Quantcast
Channel: hedge fund – ValueWalk
Viewing all 529 articles
Browse latest View live

Inflation Expectations And The Politically Polarized Course: Funny How?

$
0
0

Inflation Expectations And The Politically Polarized Course: Funny How? b y Ben Hunt, Salient Partners

Henry Hill: You’re a pistol, you’re really funny. You’re really funny.
Tommy DeVito: What do you mean I’m funny?
Henry Hill: It’s funny, you know. It’s a good story. It’s funny. You’re a funny guy. [laughs]
Tommy DeVito: What do you mean? You mean the way I talk? What?
Henry Hill: It’s just, you know. You’re just funny, it’s … funny, the way you tell the story and everything. [it becomes quiet]
Tommy DeVito: Funny how? What’s funny about it?
Anthony Stabile: Tommy, no. You got it all wrong.
Tommy DeVito: Oh, no, Anthony. He’s a big boy, he knows what he said. What did you say? Funny how?
Henry Hill: Just…
Tommy DeVito: What?
Henry Hill: Just…you know…you’re funny.
Tommy DeVito: You mean…let me understand this ’cause, you know maybe it’s me…but I’m funny how? I mean…funny like I’m a clown, I amuse you?

“Goodfellas” (1990)

George Costanza: Every instinct I have, in every aspect of life, be it something to wear, something to eat – it’s all been wrong.

“Seinfeld” (1994)

But what could a tax-the-rich plan actually achieve? As it turns out, quite a lot, experts say. Given the gains that have flowed to those at the tip of the income pyramid in recent decades, several economists have been making the case that the government could raise large amounts of revenue exclusively from this small group, while still allowing them to take home a majority of their income.
New York Times, “What Could Raising Taxes on the 1% Do? A Surprising Amount”, October 16, 2015

I was watching the Draghi press conference the other week, and I had to turn off the TV. I found myself getting so … angry … not just at what Draghi was saying, but also the live blog reaction and the live market reaction, that I decided I was better off stepping back from the actual event and trying to figure out why I was having such a powerfully negative emotional reaction to the entire charade. It’s not the charade itself. I mean, if I were outraged by every inauthentic display of central banker “communication policy” and the media lapdog response, I’d be in some sort of permanent apoplectic fit. In fact, neither the central bankers nor the media even pretend any more that extraordinary monetary policy has any sort of material impact on the real economy, which I suppose is actually progress on the authenticity scale in a perverse sort of way.

I travel a lot speaking to investors and allocators of all sizes and political persuasions. I also read a lot from a wide variety of sources, also of all sizes and political persuasions. What I’m seeing and hearing on every issue that concerns capital markets and economics is not only an accelerated polarization of policy views between the left and the right (greater “distance” between the views), but also – and more troubling – a polarization (and in many cases a non-modal distribution) of policy views within the left and the right. The kicker: I think that this polarization is almost entirely driven by monetary policy and the power/wealth inequalities it creates. Central bankers are not only planting the seeds of truly systemic instability, they are watering and tending and nurturing this particularly virulent strain of “green shoots” with their entirely intentional and entirely successful efforts to inflate financial asset prices and mandate reduced volatility in capital markets.

The fact is that maintaining massive debt and creating massive wealth – which is what central banks DO – is a political exercise, pure and simple. It’s nothing else. It’s not social science. It’s politics. Yellen and Draghi are the most powerful politicians in the world, and what makes me angry is their unwillingness to confront the essential nature of their actions, to call what they do by its real name. It makes me angry because the longer the High Church of Central Bankerdom denies and ignores the raw political impact of their actions, the more likely it is that we will have a structural political accident that will destroy every bit of the debt maintenance and wealth creation that the High Church has labored so hard to build. I think we’re getting very close to that sort of political accident.

I’m pretty sure that I agree with absolutely none of Thomas Piketty’s policy prescriptions. And the impact of his bugbear – tax policy – on wealth inequality is laughably minor compared to the impact of a triple in the S&P 500 market cap or central bank purchases of trillions of dollars of bonds. But if you don’t recognize that Piketty has a point when he says that today’s wealth inequality is both outrageous and poisonous, you’re just not paying attention. Increased wealth inequality always leads to increased political polarization, within and between countries, within and between political entities. That was true in the 1870s, that was true in the 1930s, and it’s true today.

What happens when you get greater political polarization? The center does not hold. You get Bizarro world. You get political outcomes that cannot be anticipated by econometric or median voter models. You get political outcomes that will be perceived as illegitimate by a meaningful number of citizens. You get the New York Times writing encouragingly that even with a more aggressive tax regime, the Federal government could still “allow” citizens to take home 50% of their income. Wait. What?

Here’s a fairly typical example of the polarization phenomenon I’m talking about, this from the Pew Research Center based on 1994 – 2014 data. Everything in this chart is significantly worse today, and the same chart could be drawn for every other country on earth (including one-party states like China). You could also draw a chart with exactly the same dynamic for Congress. Or FOMC voting member views on raising rates. Or financial advisor views on liquid alternatives. Seeing polarization is like seeing the homeless … once you start looking for it, you will see it everywhere.

Inflation Expectations

It’s not just the distance between the median Democrat voter and the median Republican voter that concerns me, it’s the shape of the Democrat electorate and the shape of the Republican electorate. A consensus outcome, where a significant majority buys into a final decision, is more difficult when the median voters are farther apart, but by no means impossible. It’s the lack of a single modal “peak” near the median voter within each party that makes consensus so very, very difficult. Why? Because the human animal has designed any number of effective preference aggregation schemes (elections and markets, for example), but none of them work very well at all when preferences are all over the map, when there is no “peakedness” to the preference distribution. There is no voting scheme that can identify a consensus when there is no consensus to be had, and that’s true whether you’re talking about the Republican party or the American electorate at large or the FOMC or the Chinese Politburo. On the contrary, the

The post Inflation Expectations And The Politically Polarized Course: Funny How? appeared first on ValueWalk.

Sign up for our free newsletter

David Einhorn’s Greenlight Capital Has Small October Recovery

$
0
0

David Einhorn’s Greenlight Capital returned -14.3% net of fees and expenses for the third quarter of 2015 compared to the S&P 500’s return of -8.2%. Year-to-date the fund is down 17.1% compared to a loss of 5.3% for the S&P 500, according to the fund’s October letter to investors and reviewed by ValueWalk.

Greenlight Capital 3Q15 Letter: Still Long Sune, MU, CONSOL

During October, Greenlight recovered some of its losses as the fund returned 0.7%. However, even after including these minuscule gains, the fund is still down 16.4% year-to-date.

Greenlight Capital YTD returns

Greenlight’s poor third quarter and year-to-date performance can be attributed to the dismal performance of the fund’s three largest positions, CONSOL Energy (CNX), SunEdison (SUNE) and Micron (MU), all of which performed abysmally during the quarter. The performance of these three key positions coupled with Greenlight’s highly concentrated portfolio are just two factors that have weighed heavily on the fund this year. Year-to-date CONSOL, SunEdison and Micron are down 78%, 61% and 51% respectively.

Greenlight Capital: Investment commentary

Greenlight remains convinced that all three of its largest holdings, CONSOL, SunEdison and Micron will work out eventually. These three companies are all misunderstood according to the fund’s analysis, and the market is misreading their financial position:

“It takes time, diligence, and possibly even some directed guidance for new investors to get up to speed. Lacking a strong incentive to dig through the numbers, some investors simply see a falling knife and look no further. This is what we see from here forward.” — Greenlight on CONSOL, SunEdison and Micron

Greenlight closed a number of positions during the quarter including:

  • Citizens Financial Group (purchased at $22.36, sold at $26.28): Lowered 2016 guidance, defeating our thesis that there was an upside to estimates.
  • LAM Research (purchased at $54.07, sold at $75.30): We believed the cycle was peaking, putting 2016 estimates at risk.
  • Spirit Aerosystems (bought at $20.28, sold at $50.55): New management improved core margins, exited unprofitable development programs and initiated a stock buyback. This led to higher earnings and a higher multiple. We exited as the shares reached fair value.
  • Intel (shorted at $34.23, covered at $29.28): We mitigated a portion of our long exposure to personal computers.
  • Robert Half (shorted at $28.96, covered at $41.61): A multiyear short where the company generally performed better than we expected.
  • St. Joe Company (shorted at $36.90, covered at $17.17): After being short for almost ten years, we decided to declare victory and move on, even though the shares remain somewhat overvalued.
  • U.S. Steel (shorted at $27.07, covered at $23.21): While we made money on this large short in a period where the S&P 500 rose substantially, we left a lot on the table by not covering the position very well, as the company ultimately achieved our bear case.

And finally, additional detail from Greenlight on what happened to its leading positions during the third quarter:

Greenlight Capital

Greenlight Capital 3Q15 Letter: Still Long Sune, MU, CONSOL

The post David Einhorn’s Greenlight Capital Has Small October Recovery appeared first on ValueWalk.

Like this article? Sign up for our free newsletter to get articles delivered to your inbox Rupert may hold positions in one or more of the companies mentioned in this article. You can find a full list of Rupert's positions on his blog. This should not be interpreted as investment advice, or a recommendation to buy or sell securities. You should make your own decisions and seek independent professional advice before doing so. Past performance is not a guide to future performance.

Ken Griffin Has Katy Perry At Citadel Birthday Party

$
0
0

The richest man in Illinois invited pop star Katy Perry to play the 25th anniversary party of his Chicago hedge fund, Citadel.

Perry allegedly charges $500,000 per set and played at this year’s Super Bowl, but money is no object for Griffin. The hedge fund billionaire recently finalized a divorce, and is still worth $7.1 billion, according to DNA Info.

Katy Perry citadel
Image source: Wikimedia Commons

Massive Chicago celebration marks 25 years of growth at Citadel

Left Shark performed alongside Perry at a lavish bash which took place just a few weeks after Griffin’s birthday. Perry was obviously not chosen for her politics, with the staunch Clinton supporter singing at a bash organized by the generally conservative Citadel CEO.

The high-profile event was attended by 1,500 guests commemorating the 25th anniversary of Citadel, and was held at Cinespace Chicago in the Lawndale district. Other parties are being planned for New York and London.

Griffin reportedly made a speech at the Chicago event, thanking those involved in the transformation of Citadel from a small firm which managed just $500 million in assets to a hedge fund behemoth with over $25 billion on its books. He gave special thanks to his mother, who was present in the crowd.

Further parties planned in New York and London

The Citadel CEO then introduced Perry, who sang for over an hour before a cameo from Left Shark, the backup dancer who found fame during Perry’s Super Bowl halftime performance. Food at the event was provided by RPM and Frontera Grill, and as the festivities ended around midnight food trucks handed out take-home tacos to any guests that were still feeling peckish.

The Citadel party in New York will be headlines by Maroon 5, while the headliner for the London event has not been confirmed. Celebrating the success of Citadel comes at a good time for Griffin, who only recently reached a settlement in an acrimonious divorce battle that had dragged on since July 2014.

A divorce trial was set to begin on October 5 this year, but Griffin and estranged wife Anne Dias Griffin reached a settlement a couple of days before. Griffin apparently has plenty left in the bank even after the settlement. It looks like he is enjoying the single life.

Below is Citadel’s letter to investors on the occasion of the hedge fund’s 25 anniversary:

Dear Investor,

As we mark our 25th anniversary, I want to take a moment to express my gratitude for your trust and support over the years.

I’ve often thought of successful entrepreneurs as individuals who have just the right expertise — at just the right moment — to solve the emerging problems of their time. When I started Citadel 25 years ago, my expertise in software engineering and mathematics created significant competitive advantages in a world where the power of computational finance was appreciated by few.

But the opportunity that was born of that fortunate positioning would never have grown into the success of today without crucial early support. Frank Meyer, co-founder of Glenwood Partners, empowered the formation of Citadel with his willingness to take a chance on an unproven twenty-year-old portfolio manager. With the tailwind of strong early returns, and the enthusiastic support of our investors, Citadel took off.

In our firm’s earliest days, our understanding of the power of great software engineering and quantitative analytics helped Citadel stand out. But history is littered with companies started by entrepreneurs who failed to sustain such early bursts of success. In fact, the average lifespan for a hedge fund is just a few years. What, then, has driven our longevity and our success? The answer is simple: Our sustainable competitive advantage doesn’t just come from our technical prowess; it comes from assembling teams of extraordinary individuals who have the creativity, resourcefulness, ambition and tenacity to take on the world.

The early days of Citadel had a constant rhythm: research, problem-solve, program, trade, interview. Repeat. In our first decade, I interviewed about five thousand people in pursuit of the talent that would create our future. As our success grew, we became known across the four corners of finance not just for our outstanding returns, but also for our outstanding people.

Today, I’m proud that Citadel is seen as a beacon for the best and brightest. It is incredible to come to work every day surrounded by individuals whose insights and efforts place us at the forefront of finance. As I reflect upon the exceptional team that is Citadel today, I believe our greatest moments lie not in our past, but in our future.

Over the past twenty-five years, I have enjoyed a remarkably challenging and rewarding career — a career defined by the extraordinary people for whom and with whom I have worked. Thank you for your continued support and for your trust in my team and in me.

With all my best,

Ken

The post Ken Griffin Has Katy Perry At Citadel Birthday Party appeared first on ValueWalk.

Like this article? Sign up for our free newsletter to get articles delivered to your inbox
Cable Car Capital’s Jacob Ma-Weaver On Hunting For Value [Part One]

$
0
0


Cable Car Capital LLC is a San Francisco-based investment adviser founded in September 2013. The asset manager was founded by Jacob Ma-Weaver and uses a concentrated, hedged, value strategy.

Jacob was kind enough to answer some questions for ValueWalk about his investment style and some of his current positions.

The interview is divided into two parts – sign up for our newsletter to ensure you do not miss part two.

To the end of September, Cable Car was up 37.2% for 2015. Since inception, Jacob Ma-Weaver’s strategy has returned 25.1% annualized for investors. You can read more about Cable Car and the group’s investment strategy at the links below.

Cable Car Capital
Cable Car Capital: Returns

Cable Car Capital’s Jacob Ma-Weaver on hunting for value

ValueWalk: First off, could you tell our readers a little about Cable Car Capital and the firm’s investment strategy?

Jacob Ma-Weaver: Cable Car is a registered investment adviser based in San Francisco that offers a concentrated, hedged approach to value investing. The firm is relatively unique in that it implements a long/short equity strategy through separately managed accounts rather than a traditional private fund structure. By registering as an investment adviser from the beginning, I was able to offer accounts to non-accredited investors, openly discuss and blog about investment ideas, provide greater transparency and liquidity to clients, and outsource much of the cost and administrative complexity of a start-up investment management firm to a third-party custodian. As hedge fund investors demand additional custodial requirements and back office capabilities, I think Cable Car’s structure is becoming a more popular model among emerging managers.

Cable Car has a broad mandate that reflects my own interests and love of engaging with intriguing businesses, securities, and people. The portfolio typically consists of 5-10 thematically diverse long positions and 10-15 short positions with a net long bias, complemented by a few special situations involving corporate reorganizations, capital structure arbitrage, and other events. The mix of geographic, size, and sector exposures is eclectic, but the one thing positions have in common is my belief that the risk of permanent capital loss is limited despite the potential for an attractive return.

VW: How do you go about looking for an investment (both long and short) at Cable Car Capital; what’s your investing process?

JMW: My security selection and due diligence processes are more situation-specific than I think most investors would admit. I read widely, follow developments at companies and in industries I’ve studied before, and talk with other investors. I am continuously trying to build on my pattern recognition skills and understanding of potential inflection points in business that could lead to mispricing. It’s hard to generalize, but I’m keeping an eye out for situations that could lead to misunderstandings or temporary dislocations in how other market participants value a business. Sometimes that means patiently waiting many months or years for the right opportunity to own or sell short a business.

I try not to restrict myself to one particular style of value investing. On the long side, I’m often drawn to companies with strong balance sheets and management teams who have the ability to earn high returns on capital, which may be out of favor due to short-term sentiment or investments that depress earnings but will create value over a longer time horizon. However, I’m also open to owning lower-quality businesses trading below net asset value. On the short side, companies with apparent accounting fraud or heavily promotional management teams and hype often catch my attention, but I’ve also found it productive to short a company in long-term secular decline.

Once I’ve identified a situation worthy of further investigation, I try to learn as much about the company as I can. A lot of the initial research process consists of identifying the right questions to ask – what risk factors need to be understood and what changes in the fundamentals will result in a different valuation in the future? It goes without saying that I spend a lot of time with the public filings, and I like to speak to management when possible, but the emphasis in the research process varies depending on the company and industry. Some businesses require more detailed financial modeling than others. Some situations involve extensive legal research or understanding of potential regulatory catalysts. I have a lot of conversations with industry participants, be they customers and suppliers, doctors and patients, or experts and consultants, to try to validate a hypothesis that differs from the rest of the market.

Cable Car Capital
Cable Car Capital: Q3 performers

VW: How do you approach valuation?

JMW: I have a probabilistic approach to valuation. Typically, I will value a business separately under several potential scenarios, which reflect specific outcomes rather than generic bear/bull situations. The goal is not to compare the market price to an artificial expected value computed using subjective probabilities, which I think is often inappropriate given the lack of any information about the underlying distribution. Instead, I’m trying to identify situations where the valuation in even the most negative state of the world remains acceptable, but an alternative scenario is what I think will actually be most likely to happen, based upon my research.

I always like to begin my analysis with the potential downside, and from that standpoint the valuation exercise often starts with the balance sheet. In many situations, I find it helpful to compute a net asset value or liquidation value before assessing the ongoing business. Importantly, this requires understanding the whole capital structure and the rights and priority of other claims relative to the particular security I’m interested in. Even though that is usually common equity, I want the context of the entire enterprise first.

For ongoing earnings streams, I try to estimate the earnings power of the business 3-5 years into the future. By earnings power, I mean the eventual capability of the business to generate recurring free cash flow (or one of its proxies for convenience, which depending on the company and its capital structure could be EPS or some variation on operating income). That can be a straightforward calculation, or it may involve some hypothesizing about how profitability could evolve in different states of the world.

I compute the present and potential future value of the business using justified multiples as shorthand for a full discounted cash flow analysis. This part is subjective, but the multiple I’m willing to pay is a function of the company’s growth prospects, return on

The post Cable Car Capital’s Jacob Ma-Weaver On Hunting For Value [Part One] appeared first on ValueWalk.

Like this article? Sign up for our free newsletter to get articles delivered to your inbox Rupert may hold positions in one or more of the companies mentioned in this article. You can find a full list of Rupert's positions on his blog. This should not be interpreted as investment advice, or a recommendation to buy or sell securities. You should make your own decisions and seek independent professional advice before doing so. Past performance is not a guide to future performance.

Cable Car Capital’s Jacob Ma-Weaver On Retrophin And Plus500 [Part Two]

$
0
0

Cable Car Capital LLC is a San Francisco-based investment adviser founded in September 2013. The asset manager was founded by Jacob Ma-Weaver and uses a concentrated, hedged, value strategy.

Jacob was kind enough to answer some questions for ValueWalk about his investment style and some of his current positions.

The interview is split into two parts; you can find part one here.

To the end of September, Cable Car was up 37.2% for 2015. Since inception, Jacob Ma-Weaver’s strategy has returned 25.1% annualized for investors. You can read more about Cable Car, and the group’s investment strategy at the links below.

Cable Car Capital
Cable Car Capital: Returns

Cable Car Capital’s Jacob Ma-Weaver Retrophin and Plus500

ValueWalk: As of September 30, Cable Car’s five largest positions accounted for 70% of assets. Why do you believe such a concentrated portfolio is suitable, and how do you go about managing risk in such an extremely concentrated portfolio like this?  

Jacob Ma-Weaver: Cable Car’s level of concentration is a deliberate reflection of the realities of a single portfolio manager’s time and attention. I believe holding significantly more positions would reduce the degree of due diligence I could perform on each company while diversifying away much of the potential benefit of active management.

Part of the reason I am comfortable with large position sizes relates to the risk/reward framework described in part 1. If I have sufficiently convinced myself that the risk of loss is limited, I can be more comfortable tolerating price changes that do not reflect the underlying value of an asset. Also, for companies with significant non-operating balance sheet value, such as high excess net cash positions, a position’s size in the portfolio may not be reflective of the amount of capital that is truly at risk from a fundamental standpoint. Position sizing is a function first of downside risk, followed by potential return and conviction.

Because I define risk as the likelihood of permanent capital impairment, not the variance of returns, I embrace a degree of mark-to-market volatility and believe it can provide opportunities to create value on the margin. Cable Car has a maximum long position size of 30%, which is arbitrary but chosen so that extreme idiosyncratic risks or mistakes of analysis will at least be survivable. For short positions, position sizes are kept much smaller since the risk/reward dynamic is generally less favorable, and I sometimes express my views through option strategies that cap the potential loss.

Cable Car Capital
Cable Car Capital: Q3 performers

VW: One of your largest positions is specialty pharmaceutical company Retrophin. Could you give a quick run-down of your thesis for Retrophin and do you mind commenting on the company’s performance over the past three months?

JMW: Cable Car recently added to its position in Retrophin after the company hit the headlines following the political attention to drug price increases and the company’s former CEO, Martin Shkreli. Despite negative sentiment toward specialty pharmaceutical companies in general and companies with high-priced drugs, in particular, I believe Retrophin’s portfolio of marketed products and pipeline are being underappreciated by the market. Not all price increases are created equal, and I think that the company’s pricing of Thiola, a treatment for a rare kidney stone disorder called cystinuria, will withstand political scrutiny. My conversations with doctors and patients in the cystinuria community suggest that RTRX has significantly improved convenience and access to an important therapy that was in chronic shortage prior to the company’s involvement. Thiola is priced below the only approved alternative, which has more severe side effects. While eventual generic competition is likely to limit the long-term value of Thiola, it is funding continued investments in Retrophin’s development program in the meanwhile.

RTRX has a clean balance sheet with over $8 per fully diluted share in net cash and investments, and its three marketed therapeutics for rare diseases are early in the process of identifying new patients. The addressable market for Retrophin’s two bile acid disorder therapies is misunderstood by many analysts, and in my opinion, the lifetime value of the three marketed products alone significantly exceeds current enterprise value.

I believe RTRX has downside protection from its cash position and the cash flow generated by its marketed products. Also, there are plausible scenarios that could result in a much higher valuation in the future. I am generally loathe to pay a premium for pipeline candidates in clinical trials, and I do not think any pipeline value is reflected in the market price. However, RTRX has significant option value from several promising rare disease therapies that would materially increase the company’s value if approved.

VW: Finally, Cable Car hit the headlines in the UK earlier this year when you revealed in a series of blog posts that you were short spread betting and CFD provider, Plus500. Firstly, how did you go about putting together your short thesis for PLUS, and where did the idea come from? Secondly, how would you respond to the accusation that your method of publicizing Cable Car’s PLUS short could be construed as market manipulation?

JMW: Great question. I’m glad of any opportunity to defend published short research, which plays a very important role in maintaining honest, fair, and transparent capital markets. Disseminating a thoroughly researched, factual, and an accurate short thesis is emphatically not market manipulation. If anything, it is the exact opposite of market manipulation, as it seeks to correct artificial prices based on false or misleading information and misconceptions in the marketplace. Contributing to the public’s understanding of a business and the market’s proper allocation of resources, at great risk and expense, is something we should celebrate. Certainly there are some short sellers whose work is premised on conjecture or distortion, but the market has a way of being very unforgiving of inaccuracies and unfounded speculation. The same is true of long-biased authors. As long as an author’s position is disclosed and facts are distinguished from opinions, in my opinion publishing investment research provides a service to the market.

I first became aware of PLUS through industry research supporting an unrelated investment (long) in a financial exchange last year. The reported profitability seemed too good to be true and worthy of fuller investigation, but I got much more interested in the business model after they emerged relatively unscathed from the Swiss National Bank’s decision to remove the CHF peg. Dan McCrum’s excellent series at the Financial Times provided a jumping off point for a lot of additional forensic accounting work and background investigation.

The post Cable Car Capital’s Jacob Ma-Weaver On Retrophin And Plus500 [Part Two] appeared first on ValueWalk.

Like this article? Sign up for our free newsletter to get articles delivered to your inbox Rupert may hold positions in one or more of the companies mentioned in this article. You can find a full list of Rupert's positions on his blog. This should not be interpreted as investment advice, or a recommendation to buy or sell securities. You should make your own decisions and seek independent professional advice before doing so. Past performance is not a guide to future performance.
Q3 Hedge Fund Trends: Berkshire Hot, Medtronic Not

$
0
0

It’s not secret that hedge funds tend to cluster in several key stocks, which can have adverse effects as we’ve seen with Valeant Pharmaceuticals Int’l, although, this clustering can be useful for generating trading ideas.

With that in mind, here are the top five hedge fund ‘buys’ and ‘sells’ of the third quarter, based on the 13Fs already filed with the SEC. I should point out that these figures are limited to only value-orientated hedge funds.

Other ValueWalk Q3 hedge fund trends  coverage:


Q3 hedge fund trends: Top buys

1. Company: American Express

  • Number of funds buying: 2
  • Number of funds adding: 4
  • Number of funds reducing: 3
  • Number of funds selling: 0

2. Company: Berkshire Hathaway CL B

  • Number of funds buying: 0
  • Number of funds adding: 5
  • Number of funds reducing: 1
  • Number of funds selling: 0

3. Company: Du Pont (E.I.)

  • Number of funds buying: 1
  • Number of funds adding: 3
  • Number of funds reducing: 0
  • Number of funds selling: 0

4. Company: AT&T Inc

  • Number of funds buying: 1
  • Number of funds adding: 3
  • Number of funds reducing: 0
  • Number of funds selling: 1

5. Twenty-First Century Fox

  • Number of funds buying: 1
  • Number of funds adding: 3
  • Number of funds reducing: 0
  • Number of funds selling: 2

Q3 hedge fund trends: Top sells

Medtronic plc tops the list of the company with the most hedge fund sells, closely followed by Cisco:

1. Medtronic plc

  • Number of funds buying: 0
  • Number of funds adding: 0
  • Number of funds reducing: 5
  • Number of funds selling: 1

2. Cisco Systems

  • Number of funds buying: 0
  • Number of funds adding: 3
  • Number of funds reducing: 4
  • Number of funds selling: 1

3. Goldman Sachs Group

  • Number of funds buying: 0
  • Number of funds adding: 0
  • Number of funds reducing: 4
  • Number of funds selling: 1

4. Baker Hughes

  • Number of funds buying: 1
  • Number of funds adding: 2
  • Number of funds reducing: 2
  • Number of funds selling: 3

5. Microsoft Corp.

  • Number of funds buying: 0
  • Number of funds adding: 2
  • Number of funds reducing: 5
  • Number of funds selling: 0
Sells Q3 hedge fund trends 13F Buys
Q3 hedge fund trends
Q3 hedge fund trends 13F Buys Q3 hedge fund trends
Q3 hedge fund trends

The post Q3 Hedge Fund Trends: Berkshire Hot, Medtronic Not appeared first on ValueWalk.

Like this article? Sign up for our free newsletter to get articles delivered to your inbox Rupert may hold positions in one or more of the companies mentioned in this article. You can find a full list of Rupert's positions on his blog. This should not be interpreted as investment advice, or a recommendation to buy or sell securities. You should make your own decisions and seek independent professional advice before doing so. Past performance is not a guide to future performance.

Hedge Fund Crowding Costs: Q3 2015

$
0
0

Applying a robust risk model to hedge fund holdings data helps avoid losses and yields profitable opportunities. In this article, we highlight the sectors with the largest Hedge Fund losses due to crowding in Q3 2015, which sum to $4 billion. Our methodology provides an early-warning system for losses in crowded names. This analysis also identifies crowded stocks beaten up by hedge fund liquidations, which tend to mean-revert.

Analyzing Hedge Fund Sector Crowding

Our edge comes from a central thesis: the most crowded stocks are those that contribute the most to hedge fund stock-specific volatility (volatility of alpha). Furthermore, the direction of this alpha (positive or negative) is a leading indicator. A robust analysis of the AlphaBetaWorks Statistical Equity Risk Model allows us to identify stocks that are the highest contributors to stock-specific volatility for hedge funds in each sector.  These are the most crowded stocks that stand to benefit the most from accumulation and stand to lose the most from liquidation.

While a static crowding analysis using our risk model provides valuable insights, we go further by identifying Hedge Fund Aggregate Sector Alpha – the alpha (stock-specific performance) of aggregated hedge fund portfolios by sector.  This makes the analysis dynamic: If Hedge Fund Aggregate Sector Alpha is trending up, capital is flowing into crowded stocks. Conversely, if it is trending down, capital is flowing out of crowded stocks – often abruptly. Yes, crowding is good at some times and bad at others.  Further, Hedge Fund Aggregate Sector Alpha trends persist for months and years, providing advanced notice of losses. Importantly, crowded stocks hit hard by liquidations tend to mean-revert: the worst risk-adjusted performers often become attractive long opportunities.

Hedge Fund Sector Aggregates

We create aggregate portfolios of hedge fund positions in each sector. Each such sector portfolio is a Hedge Fund Sector Aggregate within which we identify the highest contributors to security-specific (residual) volatility (the most crowded stocks). This follows the approach of our earlier articles on hedge fund crowding.

The Hedge Fund Sector Aggregate Alpha (?Return, residual, or security-specific return) measures hedge fund security selection performance in a sector. It is the return HF Sector Aggregate would have generated if markets had been flat. ?Return can indicate accumulations and liquidations.

The AlphaBetaWorks Statistical Equity Risk Model, a proven tool for forecasting portfolio risk and performance, estimated factor exposures and residuals. Without an effective risk model, simplistic crowding analyses ignore the systematic and idiosyncratic exposures of positions and typically merely identify companies with the largest market capitalizations.

Sectors with the Largest Losses from Hedge Fund Crowding

During Q3 2015, hedge funds lost $4 billion to security selection in the five sectors below. Said another way: if hedge funds had simply invested passively with the same risk, their sector long equity portfolios would have made $4 billion more. The monthly losses are listed (in $millions) below:

7/31/2015 8/31/2015 9/30/2015 Total
Other Consumer Services -101.16 -113.93 -312.84 -426.77
Oil and Gas Pipelines 472.21 -465.63 -10.29 -475.93
Specialty Chemicals -155.87 196.41 -730.73 -534.32
Oil Refining and Marketing 262.69 -167.15 -388.52 -555.67
Semiconductors -240.71 -1,422.70 -660.95 -2,083.65

The Semiconductor Sector was particularly painful for hedge funds in Q3 2015, which we examined in a previous article.

Below we provide our data on three of the above sectors: historical Hedge Fund Sector Alpha and the most crowded names.

Specialty Chemicals – Hedge Fund Alpha and Crowding

Hedge Fund Specialty Chemicals Security Selection Performance

Hedge Fund Specialty Chemicals Sector Aggregate Historical Security Selection Performance

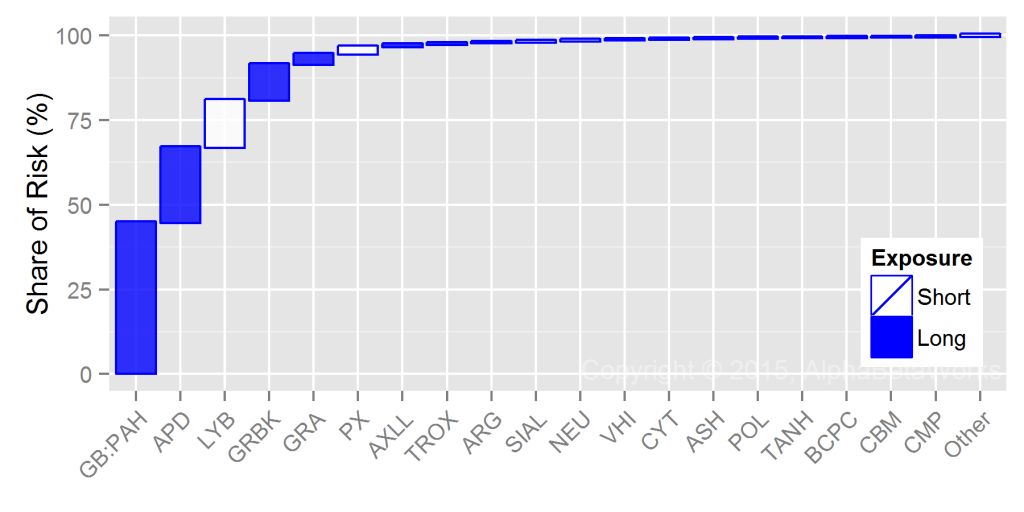
Hedge Fund Specialty Chemicals Crowding

Chart of the stock-specific hedge fund crowding the cumulative contributors to the residual variance of Hedge Fund Specialty Chemicals Sector Aggregate Portfolio relative to Market

The following table contains detailed data on these crowded holdings:

Exposure (%) Net Exposure Share of Risk (%)
HF Sector Aggr. Sector Aggr. % $mil Days of Trading
GB:PAH Platform Specialty Products Corp. 17.59 2.52 15.07 1,351.8 14.3 44.62
APD Air Products and Chemicals, Inc. 47.46 13.89 33.57 3,010.8 13.7 22.09
LYB LyondellBasell Industries NV 3.36 23.03 -19.67 -1,764.2 -5.9 14.04
GRBK Green Brick Partners, Inc. 2.99 0.25 2.74 245.7 79.7 10.58
GRA W. R. Grace \& Co. 11.76 3.45 8.32 745.8 11.0 2.99
PX Praxair, Inc. 0.31 16.29 -15.98 -1,433.5 -5.9 2.21
AXLL Axiall Corporation 2.79 1.20 1.59 142.8 4.5 0.74
TROX Tronox Ltd. 1.80 0.45 1.35 121.2 14.2 0.36
ARG Airgas, Inc. 0.19 3.77 -3.59 -321.8 -4.1 0.33
SIAL Sigma-Aldrich Corporation 3.32 7.88 -4.56 -408.6 -2.3 0.28
NEU NewMarket Corporation 0.23 2.61 -2.38 -213.4 -6.0 0.26
VHI Valhi, Inc. 0.02 0.91 -0.88 -79.2 -240.2 0.26
CYT Cytec Industries Inc. 0.07 2.04 -1.97 -176.5 -2.0 0.18
ASH Ashland Inc. 1.66 3.89 -2.23 -200.0 -2.4 0.18
POL PolyOne Corporation 0.19 1.65 -1.46 -131.2 -4.3 0.10
TANH Tantech Holdings Ltd. 0.00 0.19 -0.19 -17.3 -2.7 0.09
BCPC Balchem Corporation 0.00 0.82 -0.82 -73.4 -8.8 0.07
CBM Cambrex Corporation 0.06 0.65 -0.59 -53.2 -2.1 0.06
CMP Compass Minerals International, Inc. 0.15 1.31 -1.16 -104.0 -4.8 0.06
Other Positions 0.29 0.51
Total 100.00

Oil Refining and Marketing – Hedge Fund Alpha and Crowding

Hedge Fund Oil Refining and Marketing Security Selection Performance

Hedge Fund Oil Refining and Marketing Sector Aggregate Historical Security Selection Performance

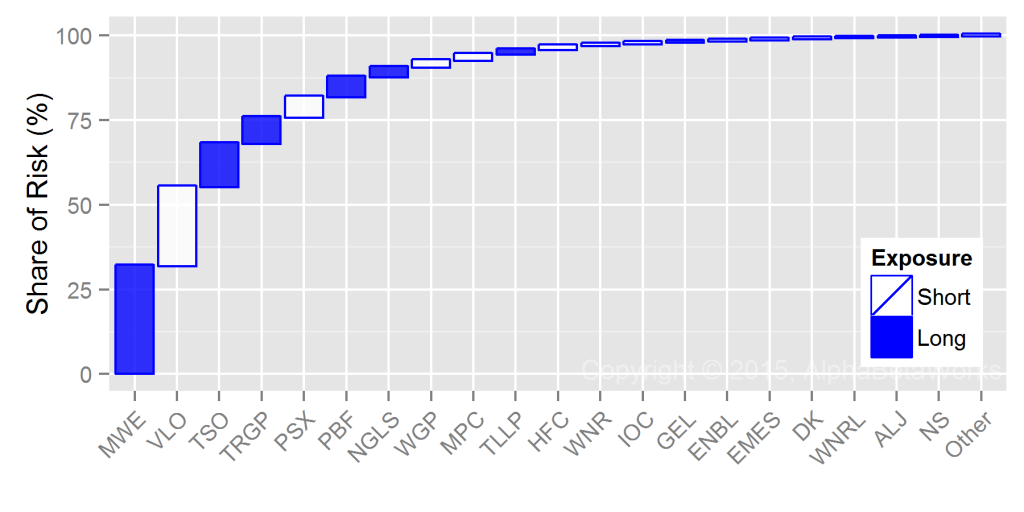
Hedge Fund Oil Refining and Marketing Crowding

Chart of the stock-specific hedge fund crowding the cumulative contributors to the residual variance of Hedge Fund Oil Refining and Marketing Sector Aggregate Portfolio relative to Market

The following table contains detailed data on these crowded holdings:

Exposure (%) Net Exposure Share of Risk (%)
HF Sector Aggr. Sector Aggr. % $mil Days of Trading
MWE MarkWest Energy Partners, L.P. 18.23 5.31 12.92 848.9 6.1 31.86
VLO Valero Energy Corporation 0.38 16.06 -15.68 -1,030.4 -2.7 23.34
TSO Tesoro Corporation 14.32 5.36 8.96 589.0 1.4 12.74
TRGP Targa Resources Corp. 8.99 2.52 6.47 425.3 8.7 7.76
PSX Phillips 66 9.21 21.86 -12.66 -831.8 -2.8 6.03
PBF PBF Energy, Inc. Class A 6.80 1.23 5.56 365.6 7.8 5.84
NGLS Targa Resources Partners LP 8.74 3.52 5.21 342.7 6.2 2.84
WGP Western Gas Equity Partners LP 3.58 6.63 -3.05 -200.5 -7.4 2.06
MPC Marathon Petroleum Corporation 9.59 14.34 -4.75 -312.0 -1.1 1.81
TLLP Tesoro Logistics LP 5.12 2.33 2.79 183.1 3.5 1.45
HFC HollyFrontier Corporation 1.29 4.22 -2.93 -192.3 -1.4 1.11
WNR Western Refining, Inc. 0.21 2.10 -1.89 -124.5 -1.4 0.61
IOC Interoil Corporation 0.66 1.50 -0.84 -55.3 -6.9 0.49
GEL Genesis Energy, L.P. 4.35 2.20 2.15 141.1 6.2 0.34
ENBL Enable Midstream Partners LP 0.39 1.73 -1.34 -88.2 -31.6 0.33
EMES Emerge Energy Services LP 0.01 0.43 -0.42 -27.6 -6.1 0.29
DK Delek US Holdings, Inc. 0.00 1.07 -1.07 -70.0 -1.2 0.26
WNRL Western Refining Logistics, LP 1.57 0.36 1.21 79.5 15.0 0.24
ALJ Alon USA Energy, Inc. 0.00 0.67 -0.67 -44.1 -2.3 0.18
NS NuStar Energy L.P. 3.50 2.33 1.17 76.9 1.4 0.15
Other Positions 0.07 0.28
Total

Semiconductors – Hedge Fund Alpha and Crowding

Hedge Fund Semiconductor Security Selection Performance

Hedge Fund Semiconductors Sector Aggregate Historical Security Selection Performance

Given the magnitude of recent semiconductor sector liquidations and the record of mean-reversions, the following crowded hedge fund semiconductor bets may now be especially attractive:

Hedge Fund Semiconductor Crowding

Chart of the stock-specific hedge fund crowding the cumulative contributors to the residual variance of Hedge Fund Semiconductors Sector Aggregate Portfolio relative to Market

The following table contains detailed data on these crowded holdings:

Exposure (%) Net Exposure Share of Risk (%)
HF Sector Aggr. Sector Aggr. % $mil Days of Trading
SUNE SunEdison, Inc. 33.18 1.82 31.36 2,550.9 9.6 86.72
MU Micron Technology, Inc. 18.87 3.95 14.93 1,214.1 2.9 8.85
INTC Intel Corporation 3.72 27.94 -24.22 -1,970.2 -1.6 2.01
SEMI SunEdison Semiconductor, Inc. 3.22 0.14 3.08 250.7 52.5 0.38
SWKS Skyworks Solutions, Inc. 0.04 3.85 -3.82 -310.4 -0.9 0.38
TXN Texas Instruments Incorporated 0.09 10.38 -10.28 -836.6 -1.9 0.32
NXPI NXP Semiconductors NV 7.90 4.41 3.49 283.6 1.0 0.29
AVGO Avago Technologies Limited 3.29 6.69 -3.40 -276.3 -0.5 0.18
FSL Freescale Semiconductor Inc 0.02 2.40 -2.38 -193.5 -5.2 0.17
ON ON Semiconductor Corporation 3.39 0.97 2.42 196.6 4.3 0.08
MLNX Mellanox Technologies, Ltd. 1.89 0.43 1.45 118.3 0.7 0.08
BRCM Broadcom Corporation Class A 7.81 5.51 2.30 187.2 0.5 0.07
MX MagnaChip Semiconductor Corporation 0.92 0.05 0.87 70.9 31.2 0.07
ADI Analog Devices, Inc. 0.05 3.90 -3.85 -312.9 -1.7 0.06
QRVO Qorvo, Inc. 1.13 2.32 -1.19 -96.7 -1.1 0.06
NVDA NVIDIA Corporation 0.58 2.10 -1.51 -123.1 -0.4 0.04
GB:0Q19 CEVA, Inc. 1.25 0.08 1.17 95.5 30.7 0.04
MRVL Marvell Technology Group Ltd. 0.04 1.32 -1.28 -104.4 -0.9 0.03
MXIM Maxim Integrated Products, Inc. 0.34 1.90 -1.56 -126.9 -1.7 0.02
MXL MaxLinear, Inc. Class A 0.74 0.12 0.62 50.6 2.8 0.02
Other Positions 0.36 0.13
Total

Conclusions

  • Data on the crowded names and their alpha can reduce losses and provide profitable investment opportunities.
  • A robust and predictive equity risk model is necessary to accurately identify hedge fund crowding.
  • Allocators aware of crowding can gain new insights into portfolio risk, manager skill, and fund differentiation.
  • Crowded bets tend to mean-revert following liquidation: the worst risk-adjusted performers in a sector become the best.
The information herein is not represented or warranted to be accurate, correct, complete or timely.
Past performance is no guarantee of future results.
Copyright © 2012-2015, AlphaBetaWorks, a division of Alpha Beta Analytics, LLC. All rights reserved.
Content may not be republished without express written consent.

The post Hedge Fund Crowding Costs: Q3 2015 appeared first on ValueWalk.

Like this article? Sign up for our free newsletter to get articles delivered to your inbox

13F Filings For Q3 2015: Hedge Fund Round-Up

$
0
0

Below is a summary of 3Q equity hedge fund holdings from Sept. 30 13F filings by several top funds, with some of the new, added, cut as well as exited positions for each; some stakes may have previously been reported in separate filings.

Other ValueWalk Q3 hedge fund trends  coverage:

Jana Partners hedge fund 13F filing

  • Buys: ARMK, BAX, BUFF, FIS, K, MAT, MSFT, SBH, ZTS
  • Adds: AGN, BKD, CAG
  • Cuts: RAX, GLNG, LGF, STRZA, TWX
  • Liquidates: AER, AAPL, ASH, BKFS, CSX, ETN, EBAY, GNRT, GE, HDS, JCI, MDLZ, NCR, PF, PCP, HOT, TEGP, TRU, URI, UNVR, VRX, WMB.

Jeffrey Ubben — ValueAct Capital hedge fund 13F filing

  • Buys: Towers Watson & Co.
  • Adds: American Express, Twenty-First Century Fox CL B
  • Cuts: Adobe Systems, Halliburton Co.
  • Liquidates: Microsoft Corporation (announced after Q3 13F came out).

Get The Full Ray Dalio Series in PDF

Get the entire 10-part series on Ray Dalio in PDF. Save it to your desktop, read it on your tablet, or email to your colleagues.

Ray Dalio

Ray Dalio -- Bridgewater Associates Hedge hedge fund 13F filing

  • Buys: RL, T, FDX, HST, ORCL
  • Adds: SYMC, PEP, EMN, EXC, KSS
  • Cuts: AAPL, SU, FL, CNQ
  • Liquidates: CMG, ENB, VAR, SYY, CMCSA

T. Boone Pickens -- TBP Investments Management hedge fund 13F filing

  • Buys: Pdc Energy Inc, Synergy Res Corp, Whiting Pete Corp New
  • Adds: Concho Res Inc, Eog Res Inc, Wpx Energy Inc
  • Cuts: Flotek Inds Inc Del, Gulfport Energy Corp, Newfield Expl Co, Parsley Energy Inc, Pioneer Nat Res Co, Rice Energy Inc
  • Liquidates: Apache Corp, Baker Hughes Inc, Bank Amer Corp, Basic Energy Svcs Inc New, C&J Energy Svcs Ltd, Eclipse Res Corp, Encana Corp, Intrexon Corp, Jpmorgan Chase & Co, Occidental Pete Corp Del, Patterson Uti Energy Inc, Penn Va Corp, Pioneer Energy Svcs Corp, Range Res Corp, Seventy Seven Energy Inc, Suncor Energy Inc New, Wells Fargo & Co New.

Tweedy Browne CO LLC hedge fund 13F filing

  • Buys: MRC Global Inc., IBM, GE
  • Adds: GlaxoSmithKline, Royal Dutch Shell, HSBC
  • Cuts: Devon Energy Corp, National-Oilwell Varco, Inc., Johnson & Johnson
  • Liquidates: Canadian Natural Resource, ExxonMobil.

Third Avenue Management hedge fund 13F filing

  • Buys: Kennedy-Wilson Holdings Inc, Visteon Corp, DSW Inc.
  • Adds: Brookdale Senior Living, Inc., Anixter International Inc., Weyerhaeuser Co
  • Cuts: Devon Energy Corp, Comerica Incorporated, POSCO
  • Liquidates: Actuant Corporation.

Oaktree Capital Management hedge fund 13F filing

  • Buys: The Blackstone Group, WestRock Co., Infosys Ltd., Fortress Investment Group.
  • Adds: Dynegy Inc., BRF S.A., Cemex, NMI Holdings, JD.com Inc., ICICI Bank Ltd., Grupo Televisa SA, Trina Solar Ltd., AngloGold Ashanti Ltd., Banco Santander-Chile, Telefonica Brasil, YPF S.A., Capital Product Partners LP
  • Cuts: Ally Financial Inc., Eagle Bulk Shipping, Taiwan Semiconductor S.A., Banc of California Inc., Golden Ocean Grp, Mobile Telesystems, Press Ganey Hlgs, Yandex N.V., Verso Corp.
  • Liquidates: None.
Top Hedge Fund Q3 Buys
ValueWalk data

Markel Asset Management hedge fund 13F filing

  • Buys: Capital One Financial, PACCAR Inc., Cummins Inc., FedEx Corp., Cable ONE Inc., Las Vegas Sands Corp., Bard (C.R.) Inc., Baxter International Inc., Donaldson Co., Becton Dickinson.
  • Adds: Marsh & McLennan, Oaktree Capital Group LLC Cl A, Discovery Communications Inc. CL C, Harley-Davidson, Norfolk Southern Corp., Rockwell Automation Inc., Verisk Analytics Inc., Cummins Inc., American Tower Corp., Apple Inc.
  • Cuts: Federated Investors Inc.
  • Liquidates: None.

Dan Loeb -- Third Point LLC hedge fund 13F filing

  • Buys: Kraft Heinz Co., Time Warner Cable Inc., Danaher Corp., Avago Technologies.
  • Adds: Baxter International Inc., Amgen, Allergan Plc, Dow Chemical, Yum! Brands Inc., Roper Industries, Sealed Air Corp., eBay Inc., Molson Coors Brewing Co.
  • Cuts: Mohawk Industries, Constellation Brands, NXP Semiconductors NV, IAC/InterActive Corp., Smucker (J.M.), Anheuser-Busch InBev, Intrexon Corp., Clayton Williams Energy Inc.
  • Liquidates: SUNE, PSX, ALLY, DVN, AIG

Seth Klarman -- Baupost Group LLC hedge fund 13F filing


  • Buys: PayPal Holdings Inc., Twenty-First Century Fox CL B, Olin Corp., Twenty-First Century Fox, AerCap Holdings N.V., LifeLock Inc., Sunrun Inc., Orexigen Therapeutics Inc., Alcoa.
  • Adds: Cheniere Energy Inc., Pioneer Natural Resources, Antero Resources, Atara Biotherapeutics Inc., Veritiv Corp., ChipMOS TECH, Bellatrix Exploration Ltd., Biotie Therapies Corp., Sanchez Energy Corp.
  • Cuts: Ocwen Financial Corp., Micron Technology, Alliance One International Inc., Alon USA Partners LP
  • Liquidates: After the end of the quarter, Klarman sold his remaining stake in Alliance One according to the fund’s Schedule 13G filed with the SEC.

Get The Full Seth Klarman Series in PDF

Get the entire 10-part series on Seth Klarman in PDF. Save it to your desktop, read it on your tablet, or email to your colleagues.

Seth Klarman

David Tepper -- Appaloosa Management LP hedge fund 13F filing

  • Buys: Southwest Airlines, Eagle Materials Inc., WMIH Corp., Allstate Corp., Ingersoll-Rand Plc.
  • Adds: Delta Air Lines Inc., NXP Semiconductors NV, Whirlpool Corp., United Rentals, Chicago Bridge & Iron Company, Triumph Group Inc., Terex Corp.
  • Cuts: General Motors, HCA Inc, Goodyear Tire & Rubber, Apple Inc., Owens Corning, Priceline Group Inc., JetBlue Airways Corp., Alphabet Inc. CL C, Huntsman Corp., HD Supply Holdings, Eastman Chemical, USG Corp., United Continental Holdings, Ryland Group, Mylan NV, KBR Inc., Axiall Corp.
  • Liquidates: BABA, MAS, MHK, BAC, RF

Get The Full Warren Buffett Series in PDF

Get the entire 10-part series on Warren Buffett in PDF. Save it to your desktop, read it on your tablet, or email to your colleagues.

Warren Buffett

Warren Buffett -- Berkshire Hathaway hedge fund 13F filing

  • Buys: Kraft Heinz Co., AT&T Inc.,
  • Adds: International Bus. Machines, Phillips 66, Charter Communications, General Motors, Suncor Energy Inc., Axalta Coating Systems Ltd.,  Liberty Media Corp., Liberty Global Inc., Twenty-First Century Fox
  • Cuts: Goldman Sachs, Walmart, Deere & Co, Chicago Bridge & Iron, WABCO Holdings, Media General, Bank of New York
  • Liquidates: Viacom.

Michael Larson -- Bill & Melinda Gates Foundation Trust hedge fund 13F filing

  • Buys: Liberty LiLAC Group C, Liberty LiLAC Group A
  • Adds: Berkshire Hathaway CL B
  • Cuts: BP plc
  • Liquidates: None.

David Einhorn -- Greenlight Capital hedge fund 13F filing

  • Buys: VSLR, LILA, LILAK, GLBL, GRMN, CNXC
  • Adds: AAPL, GM, KORS, CBI, CNX, AER, UIL, TWX, DDS, OI, FOXA, SC, VOD
  • Cuts: MU, ACM, VOYA, SUNE, IACI, AMAT, SEMI, KS, FSAM
  • Liquidates: CFG, LRCX, SPR, HTZ, M

Kyle Bass -- Hayman Capital Management hedge fund 13F filing

  • Buys: Impax Laboratories Inc., CF Industries Holdings Inc., GW Pharmaceuticals plc, DBV Technologies S.A., ProNAi Therapeutics Inc., Eco-Stim Energy Solutions, Allergan Plc, Alcobra Ltd.
  • Adds: NMI Holdings, Endo International plc
  • Cuts: Mylan NV
  • Liquidates: PRGO, OAS, WLL, NFX, SM

Icahn Capital Management hedge fund 13F filing

  • Buys: PayPal Holdings Inc., Freeport-McMoran Inc., American International Group
  • Adds: Cheniere Energy Inc.
  • Cuts: Hologic Inc.
  • Liquidates: EBAY

Stephen Mandel -- Lone Pine Capital hedge fund 13F filing

  • Buys: AMZN, STZ, DLTR, MBLY, ATVI, TAP, EXPE, DEO, AXP
  • Adds: VRX, CHTR, JD, FB, FLT, AGN, V, WMB, EA, LNG, DVA, WBA, ULTA, SCHW, MHK, HDB, HZNP, ENDP, HBI, ANET, KSU, GRA
  • Cuts: PCLN, MSFT, MA, EQIX, NKE, ILMN, ADBE, SBAC, VMC, FNF, RLGY
  • Liquidates: LOW, HCA, MHFI, ADSK, SUNE

Prem Watsa -- Fairfax Financial Holdings

  • Buys: POSCO, Altera Corp., Yodlee Inc.
  • Adds: SandRidge Energy Inc., Lumenis Ltd., OmniVision Technologies Inc., MBIA Inc., BP plc, Rayonier Advanced Materials Inc., Ultra Petroleum Corp., Helmerich & Payne
  • Cuts: None
  • Liquidates: None.
Top Hedge Fund Q3 Sells
ValueWalk data

Glenview Capital Management, LLC

  • Buys: WRK, A, SIRI, CHTR, CP
  • Adds: CI, MCK, HTZ, HLS, TEVA
  • Cuts: ABBV, WOOF, C, ENDP, SUNE
  • Liquidates: MCD, DHR, PSX, SBGI, IMS

Glenn Greenberg -- Brave Warrior Advisors

  • Buys: Brookfield Property Partners, Brookfield Infrastructure Partners
  • Adds: Cimpress N.V., Brookfield Asset Management Inc., Microsoft Corp., Charles Schwab, Halliburton Co., Primerica, Inc.,  JPMorgan Chase WTS, Antero Resources
  • Cuts: Valeant Pharmaceuticals Int'l, JPMorgan Chase & Co., Equinix Inc.
  • Liquidates: None.

Leon Cooperman -- Omega Advisors

  • Buys: PFE, VRX, WBA, GLBL, CI, AMZN, BUFF, RUN, JCP, FN, SPWH, WCIC, WLH
  • Adds: GOOGL, ASH, HRG, PCLN, TRCO, NAVI, DOW, RLGY, TRGP, FB, NRZ, MGM, LORL, GPOR, NEWM, SNR, DAL, HLT, ABY, EFC, SUM, ATLS, BSM, GULTU, PRTK, MVC
  • Cuts: AGN, AER, SIRI, C, DISH, ETFC, TWX, EMH, FCB, CMCSK, SUNE, ASPS, KKR, LYB, NGLS, PMT, APC, KMI, ARP, MPEL, SHPG, SHLD, TCRD, KAR, GNRT, CBYL
  • Liquidates: MCK, FOXA, GM, QEP, GLPI (VRX after quarter end)

Paulson & Co hedge fund 13F filing

  • Buys: PRGO, CIT, PCP, CAM, ALTR
  • Adds: TEVA, POST, HOT, LIVN, SGYP
  • Cuts: VRX, SHPG, WLL, CSC, OAS
  • Liquidates: HMHC, BRCM, S, GULTU

Soros Fund Management

  • Buys: PYPL, CIT, SLB, KHC, AMZN
  • Adds: AGN, EBAY, LGF, EGN, LUV
  • Cuts: LYB, YPF, TWC, DOW, MON
  • Liquidates: HLF, LEN, DHI, UAL, NICE

Tiger Global hedge fund 13F filing

  • Buys: BUD, TWC, EROS, ANET
  • Adds: AMZN, FLT, VIPS
  • Cuts: JD, MA, KATE, VDSI, TDG
  • Liquidates: PCLN, WUBA, TRIP

Andreas Halvorsen's Viking Global 13F filing

  • Buys: BRCM, LH, TEVA, NFLX, HLT
  • Adds: AMZN, ANTM, MCK, AVGO, ALL
  • Cuts: ILMN, MHK, MNK, BABA, MA
  • Liquidates: MET, CI, FOXA, BIDU, BIIB

Starboard Value -- Jeff Smith 13F filing


Conviction And Volume: Measuring The Information Content Of Hedge Fund Trading

$
0
0

Conviction And Volume: Measuring The Information Content Of Hedge Fund Trading by Jonathan Rhinesmith, Scholar At Harward

Abstract

I provide novel evidence that hedge funds predict and drive the movement of asset prices towards fundamental value. Willingness to move prices, proxied by the share of trading volume consumed, reveals information: the volume consumed by quarterly hedge fund trades strongly predicts future stock returns. The top decile of purchases generates abnormal returns of 5-9% annualized during the following quarter (t-stat 4.4-6.5). Interpreting this phenomenon using the Kyle model of price impact, I test for the empirical patterns one should observe if informed (hedge fund) trades incorporate information into prices. Informed trading impounds earnings news, reducing the reaction to positive earnings announcements by 28%. Informed trading also positively
predicts contemporaneous price movement and future informed trading. These price movements do not reverse. In contrast, mutual fund trades are significantly less informative. Structural and reduced-form estimates imply that consuming 1% of quarterly volume generates 0.3%-0.5% of price impact. Taken together, these results suggest that funds incorporate substantially more information into prices than is apparent from their fund-level returns.

Conviction And Volume: Measuring The Information Content Of Hedge Fund Trading – Introduction

In this paper I study hedge fund trading with two questions in mind. First, are hedge funds informed? Second, if so, how does their information get incorporated into prices? I show that trading volume plays a key role in addressing these questions.

I draw on the intuition of the Kyle (1985) model that price impact is a function of volume. An informed fund should trade until the marginal cost of price impact equals the marginal profit of trading an additional share. Willingness to move prices reveals information: if large trades relative to volume cause price impact, then fund managers should only be willing to consume a large share of volume when their private information is particularly compelling. Following this intuition, I study the “volume consumed” – shares traded divided by total volume – by quarterly hedge fund trades.

I demonstrate that the cross section of volume consumed strongly predicts stock returns during the following quarter. The top decile of hedge fund equity purchases by volume consumed generates statistically significant outperformance of 5-9% annualized during the following quarter (t-stat 4.4-6.5). The top five deciles of purchases, representing 79% of purchases by dollar value, display statistically significant outperformance. I focus on purchases because I observe hedge funds’ long portfolios.1 These results suggest that hedge funds are informed.

To study how this information gets into prices, I test for the empirical patterns one should observe if the price impact of hedge fund trades incorporates information. Informed trades prior to the public revelation of earnings should impound earnings information into prices. The associated stocks should then react less when earnings news is revealed. Confirming this reasoning, I find that the reaction to a given positive standardized unexpected earnings surprise (SUE) is reduced by 28% for stocks in the top quintile of volume consumed relative to stocks with no hedge fund activity. I study positive surprises because of my focus on the information content of purchases. Though hedge fund purchases reduce the returns associated with a given earnings surprise, purchases nevertheless predict earnings returns unconditionally (before controlling for the level of the earnings surprise).

Hedge Fund Trading

I provide three more important pieces of evidence that hedge fund trades incorporate information into prices. First, I show that the prices of high volume-consumed positions increase as hedge funds buy them. This pattern is consistent with price impact. Second, I show that trading is persistent across time. Purchases in quarter t predict purchases in quarter t+1. In quarter t+1, funds buy a greater share of volume in stocks with high quarter t volume consumed than in stocks with low quarter t volume consumed. During quarter t+1, the former positions perform better than do the latter positions. If funds do not cause price impact, then they are leaving money on the table by not building the former positions even faster.

Third, the cumulative outperformance of high volume-consumed positions is significantly positive out to a horizon of 2-4 years. Hedge fund trading is associated with fundamental information, which I define as persistent long-horizon price movements, rather than temporary price pressure, which would revert. This test rules out the possibility that hedge funds merely predict the price impact of their own future trades.

Hedge Fund Trading

These results are based on trades identified from 13F filings. My hedge fund sample captures $200 billion of equity positions at a given time, on average, and over $500 billion by the end of the sample. The data covers $4.3 trillion of purchases, 1.0% of total volume. In contrast to large hedge fund trades, mutual fund trades that are large relative to volume are significantly less informative. Large mutual fund trades generate strong contemporaneous performance. Trades should cause price impact as they occur, regardless of information content. However, these trades predict at best marginally positive future performance, even after removing funds subject to extreme fund-level flows. This performance tends to revert over long time horizons, which should only occur for non-information-based trades.

Yet there is evidence that a subset of mutual funds are skilled. If informed volume reveals information, then volume consumed within this subset should predict future returns. I confirm this prediction using measures of skill from the literature.

Hedge Fund Trading

See full PDF below.

The post Conviction And Volume: Measuring The Information Content Of Hedge Fund Trading appeared first on ValueWalk.

Like this article? Sign up for our free newsletter to get articles delivered to your inbox

“Pharma Bro” Shkreli Buys Wu-Tang Clan Album For $2 Million

$
0
0

Famous rap collective the Wu-Tang Clan came up with a novel way of selling their latest album at auction, and notorious “pharma bro” Martin Shkreli is the lucky buyer, or as DealBreaker puts it “Emo Bro Blows $2 Million On Sole Copy Of New Wu Tang Clan Album Because He Is Desperate To Bang Taylor Swift“.

.

In March 2014 Wu-Tang Clan announced that the only copy of their latest album would be sold to the highest bidderOnce Upon A Time In Shaolin would be the most exclusive album ever, and the first of its kind to be sold in such a way, write Devin Leonard and Annmarie Hordern for Bloomberg.

Shkreli

Wu-Tang Clan unknowingly sells one-off album to controversial hedge fund boss

“We’re about to put out a piece of art like nobody else has done in the history of music,” RZA told Forbes. “We’re making a single-sale collector’s item. This is like someone having the scepter of an Egyptian king.”

Under the terms of the proposed deal the band gives the buyer total freedom to do whatever they like with the album, so long as they do not sell it for commercial gain. The identity of the buyer remained secret until now, when it was revealed that the most hated man in America (or the world), Martin Shrkreli, won the auction with a bid of $2 million.

Shrkreli made a lot of money in pharmaceutical stocks, and shot to international notoriety after raising the price of one drug by 5000%. Now he has used his money to buy a Wu-Tang Clan album which is coveted by rap fans around the world.

Shkreli has so far refused to listen to the album

It seems that Shkreli may intend to use the album as a way of making friends, or meeting a lucky lady. Before he bought the album, he was told that it would prove attractive to people that wanted to listen to it. “Then I really became convinced that I should be the buyer,” Shkreli says.

Since buying the album, Shkreli hasn’t even listened to it. He delegated the task of checking that the music was there to an employee, and dedicated his time to riling the public with a series of controversial pharmaceutical deals.

The deal was agreed before news of Shkreli’s business practices emerged, and Wu-Tang Clan members have spoken out against the purchase. RZA said that the group would now donate a large portion of the purchase price to charities.

As for the music, it might not be listened to in its entirety for some time. “I could be convinced to listen to it earlier if Taylor Swift wants to hear it or something like that,” Shkreli says. “But for now, I think I’m going to kind of save it for a rainy day.”

The post “Pharma Bro” Shkreli Buys Wu-Tang Clan Album For $2 Million appeared first on ValueWalk.

Like our Facebook page for breaking news updates and leaks.

101 Formulaic Alphas

$
0
0

101 Formulaic Alphas

Zura Kakushadze

Quantigic Solutions LLC; Free University of Tbilisi

Geoffrey Lauprete

WorldQuant LLC

Igor Tulchinsky

WorldQuant LLC

December 9, 2015

Abstract:

We present explicit formulas – that are also computer code – for 101 real-life quantitative trading alphas. Their average holding period approximately ranges 0.6-6.4 days. The average pair-wise correlation of these alphas is low, 15.9%. The returns are strongly correlated with volatility, but have no significant dependence on turnover, directly confirming an earlier result by two of us based on a more indirect empirical analysis. We further find empirically that turnover has poor explanatory power for alpha correlations.

101 Formulaic Alphas – Introduction

There are two complementary – and in some sense even competing – trends in modern quantitative trading. On the one hand, more and more market participants (e.g., quantitative traders, inter alia) employ sophisticated quantitative techniques to mine alphas.6 This results in ever fainter and more ephemeral alphas. On the other hand, technological advances allow to essentially automate (much of) the alpha harvesting process. This yields an ever increasing number of alphas, whose count can be in hundreds of thousands and even millions, and with the exponentially increasing progress in this field will likely be in billions before we know it…

This proliferation of alphas – albeit mostly faint and ephemeral – allows combining them in a sophisticated fashion to arrive at a unified “mega-alpha”. It is then this “mega-alpha” that is actually traded – as opposed to trading individual alphas – with a bonus of automatic internal crossing of trades (and thereby crucial-for-profitability savings on trading costs, etc.), alpha portfolio diversification (which hedges against any subset of alphas going bust in any given time period), and so on. One of the challenges in combining alphas is the usual “too many variables, too few observations” dilemma. Thus, the alpha sample covariance matrix is badly singular.

Also, naturally, quantitative trading is a secretive field and data and other information from practitioners is not readily available. This inadvertently creates an enigma around modern quant trading. E.g., with such a large number of alphas, are they not highly correlated with each other? What do these alphas look like? Are they mostly based on price and volume data, mean-reversion, momentum, etc.? How do alpha returns depend on volatility, turnover, etc.?

In a previous paper two of us [Kakushadze and Tulchinsky, 2015] took a step in demystifying the realm of modern quantitative trading by studying some empirical properties of 4,000 reallife alphas. In this paper we take another step and present explicit formulas – that are also computer code – for 101 real-life quant trading alphas. Our formulaic alphas – albeit most are not necessarily all that “simple” – serve a purpose of giving the reader a glimpse into what some of the simpler real-life alphas look like.7 It also enables the reader to replicate and test these alphas on historical data and do new research and other empirical analyses. Hopefully, it further inspires (young) researchers to come up with new ideas and create their own alphas.

We discuss some general features of our formulaic alphas in Section 2. These alphas are mostly “price-volume” (daily close-to-close returns, open, close, high, low, volume and vwap) based, albeit “fundamental” input is used in some of the alphas, including one alpha utilizing market cap, and a number of alphas employing some kind of a binary industry classification such as GICS, BICS, NAICS, SIC, etc., which are used to industry-neutralize various quantities.

Formulaic Alphas

In this section we describe some general features of our 101 formulaic alphas. The alphas are proprietary to WorldQuant LLC and are used here with its express permission. We provide as many details as we possibly can within the constraints imposed by the proprietary nature of the alphas. The formulaic expressions – that are also computer code – are given in Appendix A.

Very coarsely, one can think of alpha signals as based on mean-reversion or momentum.12 A mean-reversion alpha has a sign opposite to the return on which it is based. E.g., a simple mean-reversion alpha is given by

?ln(today)s open / yesterday’s close)

Formulaic Alphas

See full PDF below.

The post 101 Formulaic Alphas appeared first on ValueWalk.

Like this article? Sign up for our free newsletter to get articles delivered to your inbox

Best And Worst Hedge Fund Long Stock Pickers

$
0
0

Best And Worst Hedge Fund Long Stock Pickers by AlphaBetaWorks Insights

Who’s Been Naughty or Nice

The five top hedge fund long stock pickers with long U.S. equity AUM over $3 billion produced 10.7% average annual alpha in the past three years (through October 2015).  The five bottom hedge fund long U.S. equity stock pickers had negative alpha averaging -6.5% during the same period. Both lists contain well-known and well-followed managers with a combined long U.S. equity AUM over $100 billion. These rankings overcome the flaws of simplistic performance measures by using a persistent and hence predictive metric of alpha.

Ranking Hedge Fund Long Stock Pickers

Fund rankings usually focus on absolute or relative nominal returns. Reliance on such simplistic measures, frequently mislabeled as “alpha,” is hazardous for allocators and consultants and typically leads to picking yesterday’s winners, who tend to become tomorrow’s losers: high-beta funds in bull markets and low-beta funds in bear markets.  To overcome these flaws, AlphaBetaWorks calculates returns independent of risks taken – AlphaReturn – the performance a fund would have generated if markets had been flat. A true measure of security selection skill, AlphaReturn is strongly predictive of future stock picking performance.

To the extent a fund derives significant returns from long equity holdings, our approach helps allocators and consultants avoid losses and unhappy clients. Furthermore, absent this approach, mindless followers of famous funds are headed for disappointment.

Top and Bottom Five Hedge Funds by Stock Picking Return

A comparison of nominal long hedge fund portfolio performance to market indices is misleading, since a portfolio may be taking dramatically different risks. It follows that equating outperformance relative to S&P500 with alpha is wrong. Under this simplistic approach, leveraged market ETFs generate positive alpha in up years and negative alpha in down years – a flawed result and a dangerous criterion for investment decisions.

Adjusting returns for the factor (systematic) risks taken to generate them is required to identify stock picking return and, correspondingly, stock picking skill.

Below we list the top and bottom long U.S. equity stock pickers among the hedge funds that can be analyzed using regulatory filings:

Name AlphaBetaReturn AlphaBetaScore AlphaReturn AlphaScore BetaReturn BetaScore
Harbinger Capital Partners LLC 15.45 95.04 15.38 95.4 -0.01 49.92
Icahn Associates Holdings LLC 9.09 80.19 11.11 85.92 -2.01 23
PAR Capital Management, Inc. 8.32 95.56 10.93 98.85 -2.69 12.48
Longview Asset Management LLC 14.09 97.02 9.40 87.53 4.49 98.83
ValueAct Capital Management LP 3.29 74.01 6.73 90.06 -3.52 3.9

Hedge Funds with the Highest Long U.S. Equity Stock Picking Returns and > $3B AUM, 3-yr CAGR

Name AlphaBetaReturn AlphaBetaScore AlphaReturn AlphaScore BetaReturn BetaScore
Bridgewater Associates LP -9.05 1.86 -8.15 4.28 -0.99 28.03
Omega Advisors, Inc. -8.29 0.22 -7.19 1.25 -1.14 16.06
Pershing Square Capital Management LP -5.36 25.15 -5.83 25.01 0.28 56.73
Axiom International Investors LLC -2.62 16.93 -5.83 0.71 3.17 94.05
Paulson & Co., Inc. -5.05 14.65 -5.63 10.72 0.57 61.94

Hedge Funds with the Lowest Long U.S. Equity Stock Picking Returns and > $3B AUM, 3-yr CAGR

There are familiar fund names on both lists, with a combined $112 billion in long AUM.  While these funds’ reported returns will differ from those above due principally to factor (systematic) sources (market / sector betas, et cetera), international holdings, fixed income positions, derivatives, and shorts, AlphaReturn is a clear and predictive measure of stock picking skill reflecting returns in excess of passive risks taken. Unlike nominal returns, Sharpe Ratios, and other returns-based measures (which revert), AlphaReturn reflects what investors pay fees for: performance independent of risks taken. What’s more, both positive and negative AlphaReturns tend to persist.

The tables above also show several related skill metrics. For example, AReturn is return from market timing, and AlphaBetaReturn is total active return combining security selection and market timing. The Scores above, such as AlphaScore, quantify return consistency using a scale of 0 to 100: 0 corresponds to consistently negative returns; 100 to consistently positive.

The following charts show cumulative AlphaReturns of the best and worst 3-year long U.S. equity stock pickers from the above group. Portfolio AlphaReturns in blue compare to the peer group of all hedge funds’ long U.S. equity portfolio in gray:

Hedge Fund Long Stock Pickers

Harbinger Capital Partners LLC: Risk-adjusted Return from Security Selection (AlphaReturn), Long U.S. Equity Portfolio

Hedge Fund Long Stock Pickers

Bridgewater Associates LP: Risk-adjusted Return from Security Selection (AlphaReturn), Long U.S. Equity Portfolio

Conclusions

A comparison of nominal long hedge fund portfolio performance to market indices is misleading and can lead to allocators selecting high-return funds that are, in truth, merely high risk. Since systematic fund risk varies, the assumption that outperformance relative to S&P500 is alpha is wrong. In a rising market, allocators and consultants who make these mistakes are likely to allocate to the most aggressive managers, rather than the most skilled. In a flat or declining market, these mistakes are revealed, leading to losses, pain, and embarrassment.

The solution is using skill analytics that discriminate among the different levels of systematic risk, like AlphaBetaWorks’ AlphaReturn (among others), which reveals managers with investment skill likely to generate future alpha.

The information herein is not represented or warranted to be accurate, correct, complete or timely.
Past performance is no guarantee of future results.
Copyright © 2012-2015, AlphaBetaWorks, a division of Alpha Beta Analytics, LLC. All rights reserved.
Content may not be republished without express written consent.

The post Best And Worst Hedge Fund Long Stock Pickers appeared first on ValueWalk.

Like this article? Sign up for our free newsletter to get articles delivered to your inbox

Hedge Fund Activism: An Empirical Analysis

$
0
0

Hedge Fund Activism: An Empirical Analysis

Nicolo Colombo

17 Capital

December 22, 2009

Abstract:

This paper combines both theoretical evidence on hedge fund activism and empirical results obtained through an event study around the commencement of activism to show that the phenomenon is value-enhancing for shareholders. In particular, after defining what this form of arbitrage is, it is argued that hedge funds are best suited to engage in activism thanks to reduced conflict of interests, greater incentives to monitor, their size and less legal hurdles. Stock market reaction to announcement of activism is positive, as documented by a dataset of events from 2005 to 2008 that revealed a mean cumulative abnormal return of 4.38% on companies’ stock around the filing of Schedule 13Ds. Further analysis investigated activists’ stated goals, tactics adopted and whether the type of engagement was collaborative or hostile with existing management. Cross-sectional event study analysis by nature of approach resulted in higher abnormal returns in case of a hostile activist agenda.

Hedge Fund Activism: An Empirical Analysis – Introduction

“[…] Shareholder activists that corporate boards fear most today are hedge funds: unregulated pools of wealthy investors who take large positions in a few select companies, use their ownership position to pressure boards into strategies they claim unlock “shareholder value”. The result is often an anemic, over-leveraged company that lacks the funds to invest in long-term projects and that cannot weather economic downturn. […]. We should contemplate the possibility that increasing shareholder activism may be a cure that is worse than the disease, at least for the average investor.”

“Why Carl Icahn is bad for investors”

As it can be noted in the above commentary by UCLA Professor Lynn Stout, the phenomenon dubbed as ‘hedge fund activism’ has recently been the subject of debate in the academic, public and private sector. In particular, the focus has been oriented towards the assessment of actual benefits – accruing to shareholders – of such practice. Critics and regulatory bodies have oftentimes considered this kind of activism as a “value-destroying” practice, whose (supposedly) short-term bias inevitably damages a target’s company long-range planning and management’s strategic actions. Indeed, this view has progressively gained momentum in recent months, also because hedge funds (along with major investment banks) are negatively considered by general public the major culprits in the recent financial meltdown, too often engaging themselves in outrageous risky positions. Public anger at financial community at large has caused activists to retreat, resulting in a renewed “faith” in industrial businessmen and their ability to deliver value to shareholders. To be sure, “activism” – in the broader sense of the term – has been a constant characteristic in the corporate America’s DNA for at least two decades. Some major players who were active in the 1980s with large operations – the so-called corporate raiders who used to put pressure on “somnambulant” board of directors and eventually aimed at restructuring the company’s by often stripping its assets apart and selling them to achieve short-term gains, are still in the business, possibly facing a different environment and pursuing slightly different objectives.

The U.S. financial market represents an interesting environment where empirical evidence can be collected in order to substantiate the claim that hedge funds targeting companies to engage in activism practices are actually creating “value”. By building and analyzing a “home-made” database on hedge fund activism, we will be in the position to gain a deeper insight into the phenomenon with respect to the general current prevailing anecdotal evidence by simultaneously avoiding the problem of existing samples biases. More specifically, with a set of documented observations from 2005 to 2008 we will try to address such questions as With what objectives and through which strategies do hedge funds engage in activism? What is the market reaction to the announcement of activism? Additionally, through a classification of the attitude of engagement for each single event, we will shed some light on the abnormal returns to collaborative activism vis-à-vis a hostile (confrontational) approach. Two brief cases at the end of the paper offer some more background elements to the phenomenon.

Institutional Background

Hedge Funds : A Definition

Alfred Winslow Jones is credited with establishing one of the first hedge funds in 1949. That hedge fund invested in equities and used leverage and short selling to “hedge” the portfolio’s exposure to movements of the corporate equity markets. Significant changes occurred in the industry with respect to this second aspect, but the basic idea underlying hedge funds remains investment pooling. Investors buy shares in these funds, which then invest the pooled assets on their behalf. Although they seemingly operate like mutual funds, substantial differences can be found in their transparency, type of investors, investment strategies, liquidity, and compensation structure. As far as transparency is concerned, while mutual funds are subject to Securities Act of 1933 and the Investment Company Act of 1940 and must periodically provide the public with information on portfolio composition, hedge funds are usually set up as limited partnerships (i.e. not registered as an investment company under the Investment Company Act) and provide minimal information about portfolio composition and strategy to their investors only, as they do not register their securities offerings with Securities Act. Hedge funds have usually no more than 100 “sophisticated” investors, defined by minimum net worth and income requirements. They do not advertise to the general public (usually) and the minimum investment commitment lies in the 250,000 euro – 1,000,000 euro range. Hedge funds may effectively partake in any investment strategy (differently from mutual funds, which face limitations in using derivatives, leverage, and short-selling) and may act opportunistically as conditions evolve.

Hedge Fund Activism

Hedge Fund Activism

See full PDF below.

The post Hedge Fund Activism: An Empirical Analysis appeared first on ValueWalk.

Like this article? Sign up for our free newsletter to get articles delivered to your inbox

Hedge Fund Compliance Increasingly Focused On Cybersecurity

$
0
0

When it comes to the world’s largest hedge funds, any news regarding their positions on stocks or other asset classes can move the markets, which means cybersecurity is becoming increasingly important. Chief compliance officers are now finding themselves with a lot to learn about digital safety and just using the Internet in general. As we move into 2016, it’s important for funds and other investment firms and advisers to be aware of the changes made by the Securities and Exchange Commission this year and how they can keep their proprietary information safe until they are either ready or required to release information on their positioning.

Cyber threats cyber criminals

New expectations for chief compliance officers

Hedge fund service firm Blue River Partners has released its end of the year compliance report summarizing this year’s changes from the SEC’s Office of Compliance Inspections and Examinations (OCIE). The firm starts by highlighting an October speech by OCIE Chief of Staff Andrew Donohue, who provided a summary of what’s now expected of chief compliance officers.

Perhaps the most important piece of the puzzle is all the new laws and regulations regarding use of social media by hedge funds and cybersecurity. All it takes is one hack for insider trading to become an issue, as in theory, hackers could simply get into a fund’s systems, steal information regarding an undisclosed position, and then either buy up shares before it is disclosed and/ or release the information early after purchasing shares.

Chief compliance officers also must have a deep understanding of the firm they work for and how it identifies and resolves conflicts of interest. Further, they must understand the target customers and the firm’s policies and procedures, and have sufficient resources to comply with all the laws and regulations pertaining to compliance.

Hedge funds must be aware of cybersecurity risks

Blue River Partners points out that throughout 2015, the SEC did issue a number of risk alerts, announcing in January that it would start focusing on cybersecurity compliance in its 2015 Examination Priorities. The following month, the agency issued an alert summarizing the sweep exams that can be conducted to analyze threats that broker-dealers and investment advisers face.

In April, the OCIE issued an alert outlining a number of cybersecurity threats and advice, and then in September, the agency explained its new Cybersecurity Examination Initiative, which means hedge funds and other firms will face more tests, procedures and controls to evaluate their controls and procedures.

Blue River Partners provided the following list of helpful links for chief compliance officers to get up to speed on the new cybersecurity guidelines and compliance requirements:

Cybersecurity Interpretive Notice

Blue River Partners also reports that in August, the National Futures Association adopted its Cybersecurity Interpretive Notice, which requires all of its members to adopt and enforce an Information Systems Security Program by March 1, 2016. The program must cover a number of areas like a security and risk analysis, a description of any safeguards they are taking against threats or vulnerabilities, how they evaluate breaches that have been detected, and how they educate and train employees regarding cyber-safety.

An executive at the firm must approve the program, and its effectiveness must be continually monitored and reviewed on a regular basis.

Compliance calendar for Q1

Blue River’s report also covers the other big changes made by U.S. regulators in 2015 (those not pertaining to cybersecurity). The firm put together this calendar to help compliance officers prepare for important deadlines that are coming up in the first quarter of 2016:

Screenshot_5Screenshot_6

The firm also compiled this chart for the annual compliance obligations for 2016:

Screenshot_7Screenshot_8Screenshot_9Screenshot_10

The post Hedge Fund Compliance Increasingly Focused On Cybersecurity appeared first on ValueWalk.

Like this article? Sign up for our free newsletter to get articles delivered to your inbox

Agecroft Partners’ Top 10 Hedge Fund Industry Trends For 2016

$
0
0

Agecroft Partners’ Top 10 Hedge Fund Industry Trends For 2016 by Donald A. Steinbrugge, CFA – Agecroft Partners
Each year, Agecroft Partners predicts the top hedge fund industry trends through their contact with more than 2,000 institutional investors and hundreds of hedge fund organizations. The hedge fund industry is very dynamic and both managers and investors can benefit from anticipating, and preparing for, what changes are likely to occur. Those who effectively evolve with the industry will succeed, while stagnant firms will be left behind. Below are Agecroft’s predictions for the biggest trends in the hedge fund industry for 2016.

  1. Reduction of expected returns for a diversified Hedge Fund portfolio.  Hedge fund performance is driven by a combination of alpha (manager skill) and beta (market driven return). From 2009 to the beginning of last year, as both the fixed income and equity markets experienced strong bull markets, beta had been a tail wind for hedge fund performance that rewarded managers with net long market exposure. Over this time period, investors’ return expectations for new managers steadily declined from mid-teens back in 2009, to above 10% in 2014 and to mid-to-high single digits today. This reduction in expected returns stems mostly from the belief from many investors that beta will add very little value over the next few years due to the capital markets trading near all-time highs. This reduction of return expectations will have a broad impact throughout the hedge fund industry.
  2. Greater Demand for Hedge Fund Strategies with Low Correlations to Long Only Benchmarks. Lower return expectations for hedge funds will dramatically change the relative demand for hedge fund strategies. Higher beta strategies will be perceived as higher (and unnecessary) risk. Some of the strategies that will see a significant increase in demand include: relative value fixed income, market neutral long/short equity, CTAs, direct lending, volatility arbitrage, reinsurance and global macro. These strategies will see an increase in demand due to their perceived ability to generate alpha regardless of market direction and as a hedge against a potential market sell-off.
  3. Hedge Fund Industry Assets to Reach All Time High in 2016. Despite all the negative stories about the industry, including some recent high profile fund closures, total hedge fund industry assets will reach a new all-time high in 2016. This will be fueled by investors led by pension funds reallocating assets out of long only fixed income to enhance forward looking return assumptions and other investors shifting some assets away from long-only equities to hedge against a potential market sell-off. We expect hedge fund industry assets to rise by $210 billion, or 7%, which was derived from a forecast of a 2% increase due to net positive asset flows and a 5% increase from performance.
  4. Smaller managers will outperform. While many studies have shown stronger performance by younger and smaller funds, the 2016 landscape should provide a particularly attractive environment for smaller hedge funds. In moving to a performance environment increasingly dependent on alpha, security selection becomes even more important, especially in less efficient markets where smaller managers have a distinct advantage. Since 2009 there has been a high concentration of hedge fund investment flows to the largest managers with the strongest brands. This has caused many of these managers’ assets to swell well past the optimal asset level to maximize returns for their investors. As they become larger, it is increasingly difficult for large, multi-billion dollar funds to add value through security selection. Additionally, large fund managers are often stewards of capital for many large pension clients and thought of as ‘safe hands’ by risk adverse investment committees. They have an incentive to reduce risk in their portfolio in order to maintain assets and thereby increase the probability of continuing to collect large management fees.
  5. Pension funds reducing the average size of managers to whom they allocate. As pensions struggle to enhance returns to meet their actuarial assumptions, we will also see an increase in the speed of the evolution of pension funds’ hedge fund investment process. Historically, many pension plans started with an investment in hedge fund of funds, followed by hiring a hedge fund consultant and investing directly in, typically, the largest hedge funds with the strongest brands. As they increased their knowledge of the hedge fund industry and added to their internal research teams, they began making more independent decisions and focused on “alpha generators” which included mid-sized managers. Finally, they evolved into the “endowment fund model” or best-of-breed strategy of investing. In the final stage, hedge funds are no longer considered a separate asset class, but are incorporated throughout the pension fund’s portfolio. Five years ago a hedge fund typically needed multiple billion in AUM to be considered by pension funds, while today we estimate this has declined to $750 million and expected to go lower over time. This will have a very positive impact on the hedge fund industry.
  6. High quality marketing is essential for asset growth. The hedge fund industry is highly competitive with our estimate of over 15,000 hedge funds in the market place. In 2016, we will have continued concentration of hedge fund flows into a small percentage of managers. We expect 5% of funds to attract 80% to 90% of net assets within the industry. In order to succeed it is not enough to have a high quality product offering with a strong track record. Performance ranking among the top 10% of hedge funds puts a manager in an exclusive group of 1,500 funds.  Hedge funds with high quality product offerings must also have a best-in-breed sales and marketing strategy that deeply penetrates the market and builds a high quality brand. This requires a team of well-seasoned professionals that will project a positive image of the firm. This can be achieved by either building out an internal sales team, leveraging a leading third party marketing firm, or a combination of both. Firms that do not have a high quality sales and marketing strategy will have a difficult time raising assets.
  7. Increased Hedge Fund Marketing Activity outside the US. Marketing activity outside of the US has declined significantly over the past few years due to AIFMD requirements becoming effective within the Euro-zone. This has increased the focus on marketing to US investors by a growing number of US domiciled hedge funds (with a majority of hedge funds already located in the US) which has caused the US market place to become increasingly more competitive. Additionally, many non-US firms aggressively target the US market. We believe this trend will reverse as managers begin to realize that hedge fund investors outside the US are significantly less covered and the fact that the registration burden of selling in many non-U.S. countries is less complex than perceived. In addition, a large segment of European based investors tend to be more willing to invest in smaller managers due to their higher return potential.
  8. Continued pressure on fees. The hedge fund industry is seeing pressure on hedge fund fees from many fronts.  Large institutional investors are successfully negotiating large fee reductions from standard fees for large mandates and this pressure is expected to increase as large institutions represent a larger percentage of the market. Small hedge funds (generally those under one hundred million

    The post Agecroft Partners’ Top 10 Hedge Fund Industry Trends For 2016 appeared first on ValueWalk.

    Like this article? Sign up for our free newsletter to get articles delivered to your inbox

China: The Most Dangerous Place To Work In Finance

$
0
0

If you don’t understand what’s going on in China, you’re not alone. Even though the country is constantly in the headlines and will soon overtake the US as the world’s largest economy, China is a black box. Its economy is difficult to assess amid murky politics, unreliable data (according to Bloomberg, to this day, many Chinese people believe that Mao Zedong didn’t know millions of people were starving in the Great Leap Forward) and opaque decision-making while lawmakers and policy makers continue to introduce new rules and regulations at the drop of a hat.

China equity prices

As China is entirely impossible to predict, the region is uninvestable for most investors. And unfortunately, it doesn’t look as if it’s going to become easier to trust the country anytime soon.

President Xi Jinping’s sweeping anti-graft campaign, which has spread to the financial sector in the past year, has lead to a comprehensive round-up of executives at some of China’s largest banks, brokers, and hedge funds.

This round-up in itself is not that concerning. Many US investors would have support a similar round-up after the financial crisis. However, what’s really astonishing is the length of  list of China’s top bankers and fund managers who have been detained, disappeared, or died of unnatural causes in the past year.

Quartz has put together a summary of those members of China’s financial elite that have become the subject of an investigation during the past year and their fate.

China: The Most Dangerous Place To Work In Finance

1. Yang Zezhu

Former chairman of Changjiang Securities who resigned on 6th of January after being put under investigation for possible corruption. Fell to his death on January 27th leaving behind a suicide note. 

2. Mao Xiaofeng

Mao Xiaofeng was the youngest president of a listed Chinese bank, Minsheng, the world’s 49th largest bank. He was arrested by Communist Party’s anti-graft agency in January 2015. 

3. Lei Jie

Lei Jie, the chairman of Founder Securities, went missing in January 2015 but was released from police custody a few months ago.

4. Wang Yaoting

Wang Yaoting, the vice president of Hua Xia Bank, was was taken away in May 2015 for a corruption investigation. He appeared in court in December and charged with $164,000 in bribe-taking.

5. Li Yifei

Li Yifei, country chairwoman of Man Group’s China unit, was reported to have been taken away by mainland authorities to assist with an investigation at the end of August but reappeared a week later declaring that she’d taken an unscheduled holiday

6. Cheng Boming

Cheng Boming was Citic Securities (China’s biggest broker) president. He was probed by police for suspected insider trading in September 2015 along with eight other senior executives. 

7. Zhao Dajian

Zhao Dajian, honorary chairman or Minzu Securities and director of Founder Securities has been missing since September 22, 2015.

8. Chen Hongqiao

Chen Hongqiao was the president of China’s fifth biggest broker Guosen Securities. Chen hanged himself in his Shenzhen home in October of 2015. 

9. Xu Xiang

Xu Xiang was the general manager of Zexi Investment. Nicknamed “hedge fund brother No. 1,” Xu was detained by police during November of last year. 

10. Yim Fung

The chairman of Guotai Junan Securities, one of China’s largest brokers disappeared on November 18 and then  reappeared in late December after reportedly “assisting in certain investigations.”

11. Zhang Yun

President of China and the world’s third largest bank, Agricultural Bank of China resigned from all his posts in December after he was taken away by authorities. 

12. Guo Guangzhang

Nicknamed (by himself) “China’s Warren Buffet,” Guo, the chairman of conglomerate Fosun disappeared for four days last December. It’s still unclear why he vanished.

The post China: The Most Dangerous Place To Work In Finance appeared first on ValueWalk.

Email Shows Concern About Alan Grayson’s Hedge Fund

$
0
0

Email correspondence from June 2015 between Representative Alan Grayson and his campaign manager at the time involves concern among his staff about the political damage Mr. Grayson’s hedge fund could cause his Senate bid. Background to story and H/T To Eric Lipton of NYT

Email Shows Concern About Alan Grayson’s Hedge Fund

From: Alan Grayson
Sent: Tuesday, June 30, 2015 10:16 AM
To: Doug Dodson
Cc:
Subject: RE: Cayman Island story

I don’t see how closing the account would change anything. The media might take that as an admission of wrongdoing.


From: Doug Dodson
Sent: Tuesday, June 30, 2015 8:32 AM
To: Alan Grayson
Cc:
Subject: Cayman Island story

I am afraid we are never going to be able to win this one. The reporters want to write this story badly it is pretty obvious. They are also never going to understand it all nor do they want to because they think they are on to something here.

The reality is we will just never win this one I don’t think. These article are really good fodder for our opponents to use in ads and mail etc. To try and make you look like a hypocrite and a fraud and not the populist you claim to be. It give Murphy great cover when we want to hit him for being the Wall Street puppet.

We need a strategy that puts this thing to bed if we can find one. Right now I do have any idea what it would be. I don’t know if there are any options when it comes to the account.

I am sure this is probably not an option but is there a way to close it and say its closed because you don’t want even the hint of impropriety? I know that probably isn’t possible but we need to find something if we can. This is going to be the drip, drip, drip story that never goes away and we always come out on the wrong end.

I know how infuriating this is that they continue to write this BS but the reality is it isn’t going to go away and I am not sure we can turn it around. But we need a strategy to deal with as best we can.


From: Alan Grayson
Date: Wed, Jul 1, 2015 at 8:38 AM
Subject: RE: Cayman Island story
To: Doug Dodson
Cc:

I still think that it would be taken, wrongly, as an admission of guilt, and it would set off a new round of reports. As I said yesterday, I think that we should wait and see.


From: Doug Dodson
Sent: Tuesday, June 30, 2015 10:36 AM
To: Alan Grayson
Subject: RE: Cayman Island story

Kevin and Ken, David and I have been on the phone brainstorming this morning. I think I can speak for all of us here that if we could close it we can make this work for us not against. If we close it before this story get more traction I definitely think it becomes afoot note in the campaign. Murphy will use the articles they already have against us. That is a battle will have to fight no matter what at this point.

But if we close it now and say something we complied with everything we were supposed to do but in order to ensure that now one misunderstands and remove any appearance of impropriety I am closing this account because it is distracting the conversation away from important issues like….

I definitely think it works for us and is absolutely the best course of action.

I don’t want to drown you in emails about this all day.

Let me get back on the phone with Kevin, Ken and David and give us a chance to strategize under the premise we could close it and let us present you with our rational and come up with a plan and how we would execute it and spin this.

In my mind there is no better way to close this chapter now and move on. If we can’t close it I honestly don’t think there is a way to put it to bed or win what will become a long protracted press battle.

Doug Dodson

Clear eyes, Full Heart, Can’t Lose ” – Coach Taylor

Alan Grayson
Image Credit: Wikimedia Commons

Sign Up For Our Free Newsletter

The post Email Shows Concern About Alan Grayson’s Hedge Fund appeared first on ValueWalk.

UBS Sees Capitulation As Hedge fund Net leverage Gets To 2009 Lows

$
0
0

We see six signs of capitulation flows data,” begins UBS’s weekly European Flow Watch research note sent to clients yesterday.

According to the bank’s analysts, the six signs of capitulation in European equity markets in European equity markets are:

  • Banks: Investors have been net sellers of the banks the first time in five and half years. The recent risk-off move has seen the most net selling of any sector over January.
  • Country selling: On both a 12-week and 14-week view, Italy saw the largest net outflows since 2014. However, buying of stocks in the Core Eurozone area has spiked and has only been higher once since 2010.
  • Hedge fund net leverage at 2009 lows: Hedge fund net leverage is measured by UBS’s prime brokerage teams at 27%, the lowest recorded level since Draghi’s “whatever it takes” speech in summer 2012 and in line with levels previously seen in March 2009.
  • US investors have turned net sellers: US investors have become net sellers YTD of European ETF’s. What’s notable about this fact is that the selling is offsetting the structural growth of ETF’s.
  • US equity funds have seen the biggest outflow since March 2009: Following on from the above point, US equity funds have seen the largest outflow since March 2009 YTD. In January 2016, US equity funds saw outflows of $27.4 billion versus March 2009 outflows of $31.5 billion.
  • Cyclicals vs. Defensives: Cyclicals net selling has head to the highest level since the end of last August, and the outflows/inflows into these two sectors is reaching extreme levels.

Sentiment indicators are also showing an extremely bearish mood among investors. According to UBS’s research, the Stoxx 600 and the Bulls less Bears are both close to 2 standard deviations below their long-run average (shown in the chart below). However, UBS goes on to point out that, in the past, when bullish sentiment has been this low for European equities, over the next 12 months the European equity universe gone on to return c20%. Only time will tell if this will be the case this time around.

UBS Capitulation flows 3

Capitulation: Not all flows are created equal

As noted above, UBS’s data shows that equity flows into core European markets have remained robust over the past few months. UBS has mapped the most and least favored countries by investors. For example, the biggest net inflows were seen in France and Germany. The least favored countries were Italy and the UK. The sectors which saw the most buying were Insurance, Leisure, and Real Estate while the least favored sectors were Banks, Commodities and Basic Resources.

CDS on a number of European banks now exceed that of the Emerging Markets

So, if you’re a contrarian and believe that European markets could rise by 20% from their current depressed levels, the sector to target would be Banks, and the country to target would be Italy. Italian banks have been the worst performing sector in the core Eurozone market YTD.

The Italian financial sector is down 16.1% since the end of last year. On the other hand, Italy’s Utility sector is the Europe’s best performing sector YTD up 24.7%. For Europe as a whole, Sweden’s Consumer Discretionary sector has chalked up the worst performance, down 24.8% year-to-date.Net buying

UBS – Net buying

Looking at the underlying data of UBS’s European Equity Flows research report, it seems that in aggregate, UBS’s clients have been net buyers of European equities during January. That said, there has been a clear defensive positioning with net selling of cyclicals relative to defensives.UBS Capitulation flows 2

Moreover, hedge funds have been persistent sellers since the end of last year, and as a result, leverage in the European hedge fund complex has come down sharply. On the other hand, long only investors have been net buyers, having been net sellers the fourth quarter of last year.

ETFs/ETPs listed in Europe gathered a record 82 billion US dollars in net new assets in 2015

Interestingly, UBS’s data shows that when long only investors turn net buyers, as hedge funds turned net sellers and reduce leverage, equities are close to a bottom. In particular, long only investors were large net buyers close to the bottom of the market following the summer selloff in 2011, when the Stoxx 600 fell close to 20% over four weeks. Similarly, during the first quarter of 2009 long only investor flows seemed to flag the bottom of the market amid the financial crisis.

UBS Capitulation flows 1

On a sector by sector basis, UBS’s flows data shows that over the past 12 weeks the European Insurance sector saw the highest level of net buying since the data began in 2005. Also, the Leisure sector saw the highest level of net buying in seven years over the same period. Since the beginning of November, the Banks sector has seen the most aggressive outflows in 5 ½ years.

Contagion Is In the Air, European Banks Suffer

Sign Up For Our Free Newsletter

The post UBS Sees Capitulation As Hedge fund Net leverage Gets To 2009 Lows appeared first on ValueWalk.

Will The New Light On Wall Street’s ‘Dark Pools’ Bring Stronger Regulation?

$
0
0

Will The New Light On Wall Street’s ‘Dark Pools’ Bring Stronger Regulation?

Peter Conti-Brown and William Black discuss the latest regulatory actions over lapses in high-frequency trading.

Fair trading on Wall Street got a boost from the settlement announced two weeks ago between U.S. regulators and two investment banks over violations in operating alternative trading systems, known as “dark pools.” However, the fines totaling more than $154 million the two banks agreed to pay represent the cost of poor enforcement of existing laws and the failure to create precedents to act as deterrents, said experts at Wharton and the University of Missouri-Kansas City. Regulators need to increase their scrutiny of high-frequency trading, such as through dark pools, and identify systemic risks, if any, they added.

The debate on regulatory approaches over alternative trading systems ensued after the Securities and Exchange Commission (SEC) announced that Barclays Capital and Credit Suisse Securities have agreed to settle cases involving violations of federal securities laws governing dark pools. The New York Attorney General’s office announced parallel actions against the two firms.

Barclays admitted wrongdoing and agreed to pay penalties of $70 million, which will be split between the State of New York and the SEC, while Credit Suisse agreed to settle the charges by paying $84.3 million, with $60 million being split between the State of New York and the SEC and an additional $24.3 million in disgorgement and prejudgment interest going to the SEC relating to other violations. “These largest-ever penalties imposed in SEC cases involving two of the largest ATSs (alternative trading systems) show that firms pay a steep price when they mislead subscribers,” stated Andrew Ceresney, director of the SEC’s enforcement division.

Dark pools allow sophisticated traders to move large blocks of stocks without alerting traders who might be able to use such information for their benefit. They account for about 15% of overall trading volume in U.S. markets, and are designed to protect large investors in particular stocks from sudden price jumps or falls that may be caused by events unrelated to the fundamentals of those stocks, explained Peter Conti-Brown, Wharton professor of legal studies and business ethics. “The problem here isn’t so much that individual, day-trading humans are being ripped off,” he said. “It’s that the banks lied; they sold a product to their clients, whose entire virtue was eliminated through a backdoor.”

“… The banks lied; they sold a product to their clients, whose entire virtue was eliminated through a backdoor.”–Peter Conti-Brown

According to William Black, professor of economics and law at the University of Missouri-Kansas City, “This is the high cost of not enforcing the law and not creating precedents.” Black was formerly executive director of the Institute for Fraud Prevention and recently helped the World Bank develop anti-corruption measures, among other roles in combating white-collar crime. He said that instead of settling with the investment firms over violations, regulators must contest the cases, even if they ultimately lose those cases, and thereby create precedents.

“The creation of precedents is one of the geniuses of the Anglo-Saxon system that produces efficiency,” said Black. “The problem is if you are short of resources, it always looks efficient to settle, but the greatest efficiencies are often from not settling.” If regulators lose these cases because courts dispute their jurisdiction over such trading abuses, they could go to Congress “and ask them to fix it,” he added.

Conti-Brown and Black discussed the options for regulators in policing errant trading on the Knowledge@Wharton show on Wharton Business Radio on SiriusXM channel 111. (Listen to the podcast at the top of this page.)

A Solution That Went Awry

“Barclays … exposed its clients to the predatory traders from whom it promised to protect them,” according to a press release from New York Attorney General Eric Schneiderman. “Barclays misrepresented its efforts to police its dark pool, overrode its surveillance tool, and misled its subscribers about data feeds at the very time that data feeds were an intense topic of interest,” said Robert Cohen, co-chief of the SEC’s Market Abuse Unit.

Credit Suisse created and operated an undisclosed platform that secretly enabled two high-frequency trading firms to trade directly with orders submitted by other Credit Suisse clients, according to Schneiderman. The bank “accepted, ranked and executed over 117 million illegal sub-penny orders” through that platform, the SEC said.

“If you are short of resources, it always looks efficient to settle, but the greatest efficiencies are often from not settling.”–William Black

“It was the worst of all worlds,” said Black of the violations. “Dark pools were supposedly the great reform that would protect regular [investors],” and they promised to protect the names of investors, and identify them only by their category, he explained. “It turns out that these dark pools that had been sold as the saviors and protectors of [small investors] were actually cutting secret deals with the high-frequency traders. You thought you were safe, which creates complacency, [but] you were lied to … by two of the largest dark pool [operators].”

Slow Development of Laws

Black lamented the slow and insufficient progress in creating laws to govern high-frequency trading, even though it constitutes more than half of all equity trading, and even more on the futures market. He noted that the development of law has steadily progressed in areas such as frauds and insider trading, but not in high-frequency trading. “We get the development of this kind of case law and rules, arguments on both sides of the bar, [and] among academic circles on what constitutes insider trading, as new facts [and] new institutions come online,” he said.

“We are not getting that with high-frequency trading and dark pools. Even by their very names, they become these mysterious unknowns as they continue to grow.” Black, a financial regulator in the Reagan administration, formerly was director of litigation at the Federal Home Loan Bank Board and deputy director of the Federal Savings and Loan Insurance Corporation.

Conti-Brown noted that the regulatory actions on dark pools took off after March 2014 when Michael Lewis wrote his book, Flash Boys: A Wall Street Revolt, which focused on high-frequency trading. “Is this the only way we can get any kind of accountability? Is it just journalism?” Conti-Brown asked. “The journalism is very good … but that’s only one end of the stick,” he said. “The other end of the stick — to explain and explore and use the power of law and government to solve these issues — doesn’t follow.”

As it happens, high-frequency trading has been on regulatory radars for several years. Prior to the two latest settlements, the SEC has since October 2011 charged dark pools and other alternative trading systems in six other cases, collecting fines totaling $43.5 million. In March 2014, Schneiderman called for tougher regulatory oversight and market reforms to eliminate unfair advantages provided to high-frequency traders. His office has since reached agreements with Thomson Reuters, Business Wire and others to end business practices that provided high frequency traders an unfair advantage.

“The rigging of the stock market cannot be dismissed as a dispute between rich hedge-fund guys and clever techies,” wrote Michael Lewis in a March 2015 article in Vanity Fair magazine. “It’s not even the case that the little guy trading in underpants in his basement

The post Will The New Light On Wall Street’s ‘Dark Pools’ Bring Stronger Regulation? appeared first on ValueWalk.

Synthetic Hedge Funds – Performance And The Replication Success

$
0
0

Synthetic Hedge Funds: Performance And The Replication Success


Get The Timeless Reading eBook in PDF

Get the entire 10-part series on Timeless Reading in PDF. Save it to your desktop, read it on your tablet, or email to your colleagues.

Timeless Reading eBook

Mario Fischer

Technische Universität München (TUM)

Matthias X. Hanauer

Robeco Asset Management - Quantitative Strategies; Technische Universität München (TUM)

Robert A. Heigermoser

Technische Universität München (TUM)

October 1, 2015

Abstract:

We provide evidence on the performance and the replication success of a broad sample of 72 synthetic hedge funds from January 2009 to December 2013. Thereby, we assign the term 'synthetic hedge fund' to mutual funds and exchange-traded funds with hedge fund indices as their benchmarks. Replication success is measured through different perspectives from distributional characteristics to risk-adjusted performance. We find an overall significant underperformance of synthetic hedge funds compared to an appropriate benchmark index. Furthermore, mutual funds (associated with active portfolio management) can produce return characteristics closer to hedge fund benchmarks than exchange-traded funds (associated with passive management). From a single strategy perspective, we find a picture of heterogeneity. Regarding the market environment, we show larger return differences for unusual market conditions than for regular ones.

Synthetic Hedge Funds: Performance And The Replication Success - Introduction

In recent years, financial markets have experienced a series of unprecedented crises: a liquidity crunch that seriously affected the interbank lending market, a burst of the US housing bubble, and the subsequent banking and sovereign debt crisis. This series of events has led to a global economic downturn while the consequences are still felt today. With the drop of global base rates to a historical trough, many investors have to cope with negative real interest rates. This specifically affects institutional investors such as endowments, pension funds, and insurance companies, which are typically committed to long-term agreements that have been entered at times when interest rates were on higher levels. Consequently, institutional investors are searching for alternatives to traditional investments in order to achieve the returns needed to fulfill their obligations. Hedge funds have received noticeably increased attention in recent years. This increased interest of institutional investors reveals a significant gap between characteristics of hedge funds and institutional investors’ expectations. Institutional investors typically have high transparency requirements and impose restrictions on their investment mandates, as they are bound to strict regulatory standards. It is moreover usual that they require a certain degree of liquidity to meet their contractual obligations. On the other hand, the hedge fund industry is marketed as an absolute return industry where returns depend on manager skills. Therefore, it is common that hedge fund managers do not provide position-level transparency, have limited capacity, and resist any restrictions in their investment process. This behavior is backed by the argument that any kind of restriction cuts down performance. In addition, hedge funds charge extremely high management fees compared to traditional mutual funds and commonly require lock-up periods.

Synthetic Hedge Funds

Since it is apparent that expectations of both parties – institutional investors and hedge funds – are incompatible, ideas to obtain returns similar to hedge funds without directly investing in those funds have been brought up. Those concepts are combined under the terms ’hedge fund replication’, ’hedge fund clones’, ’hedge fund tracking’, or simply ’synthetic hedge funds’. Replicating the returns of hedge funds has gathered significant academic and practitioner interest since the beginning of the century. As a first step, it was necessary for academia to substantiate the claim that hedge fund returns are not entirely driven by manager skill.1 After the theoretical framework had been investigated, the development of two different hedge fund replication approaches could be observed: a factor-based approach which uses linear factor models of investable assets to model the time series of hedge fund returns and a payoff distribution approach which models the distributional properties of hedge fund returns. With both attempts delivering appealing results, it was only a question of time until commercially available synthetic hedge funds were issued by financial institutions.

Synthetic Hedge Funds

Those products are usually marked by several advantages when compared to real hedge fund investments. Because synthetic hedge funds are arranged as mutual funds or exchange-traded funds, higher transparency and higher liquidity is natural. Furthermore, synthetic hedge funds do not rely on a specific manager. On the one hand, this eliminates manager-specific risks. On the other hand, this prevents possible benefits from managerial skills. Since the latter comes at a high cost with the typical 2-20 fee structure of hedge funds, institutional investors are faced with the question: Is the skill of hedge fund managers worth the relatively high fees or can synthetic hedge funds provide similar net returns for investors, as their low fees might compromise for less flexibility? If so, institutional investors might receive additional benefits from synthetic hedge funds in form of higher liquidity and more transparency. As empirical evidence on the performance of these products is weak due to their short history, the present study sheds light on several aspects of synthetic hedge funds and extends previous research.

Synthetic Hedge Funds

To the best of our knowledge, we analyze the largest sample by number of considered synthetic hedge funds and by number of monthly observations to date. Besides the overall performance of this new asset class, we are the first to investigate the question of whether mutual funds or exchange-traded funds are better suited for achieving hedge fund-like returns. Furthermore, we examine the performance of synthetic hedge funds on a single strategy basis. We argue that the hedge fund universe is very heterogeneous and an overall performance comparison should be interpreted with caution. Standard hedge fund indices might not have the same style composition as the investigated sample of synthetic hedge funds. In addition to using self-constructed benchmark indices that match the style composition of our sample, we investigate both approaches of synthetic hedge funds: the factor-based approach (by using factor models and tracking errors) and the payoff distribution approach (by testing return distributions).

Synthetic Hedge Funds

The remainder of this study is organized as follows. Section 2 provides a theoretical overview of synthetic hedge funds and the two most popular replication approaches. Also included is a literature review regarding the empirical performance of synthetic hedge funds. Our unique dataset of 72 commercially available synthetic hedge funds and the portfolio construction is described in Section 3. Section 4 provides our empirical results as well as robustness tests. Finally, Section 5 summarizes our main results.

See full PDF below.

The post Synthetic Hedge Funds – Performance And The Replication Success appeared first on ValueWalk.

Viewing all 529 articles
Browse latest View live


<script src="https://jsc.adskeeper.com/r/s/rssing.com.1596347.js" async> </script>